DPP7
[ENSRNOP00000017271]
Main page
| | | Plot |
Mito |
Lyso |
|
Perox |
ER |
Golgi |
PM |
Cytosol |
Nucleus |
|
| Expt A |
 8
8
peptides |
55
spectra |
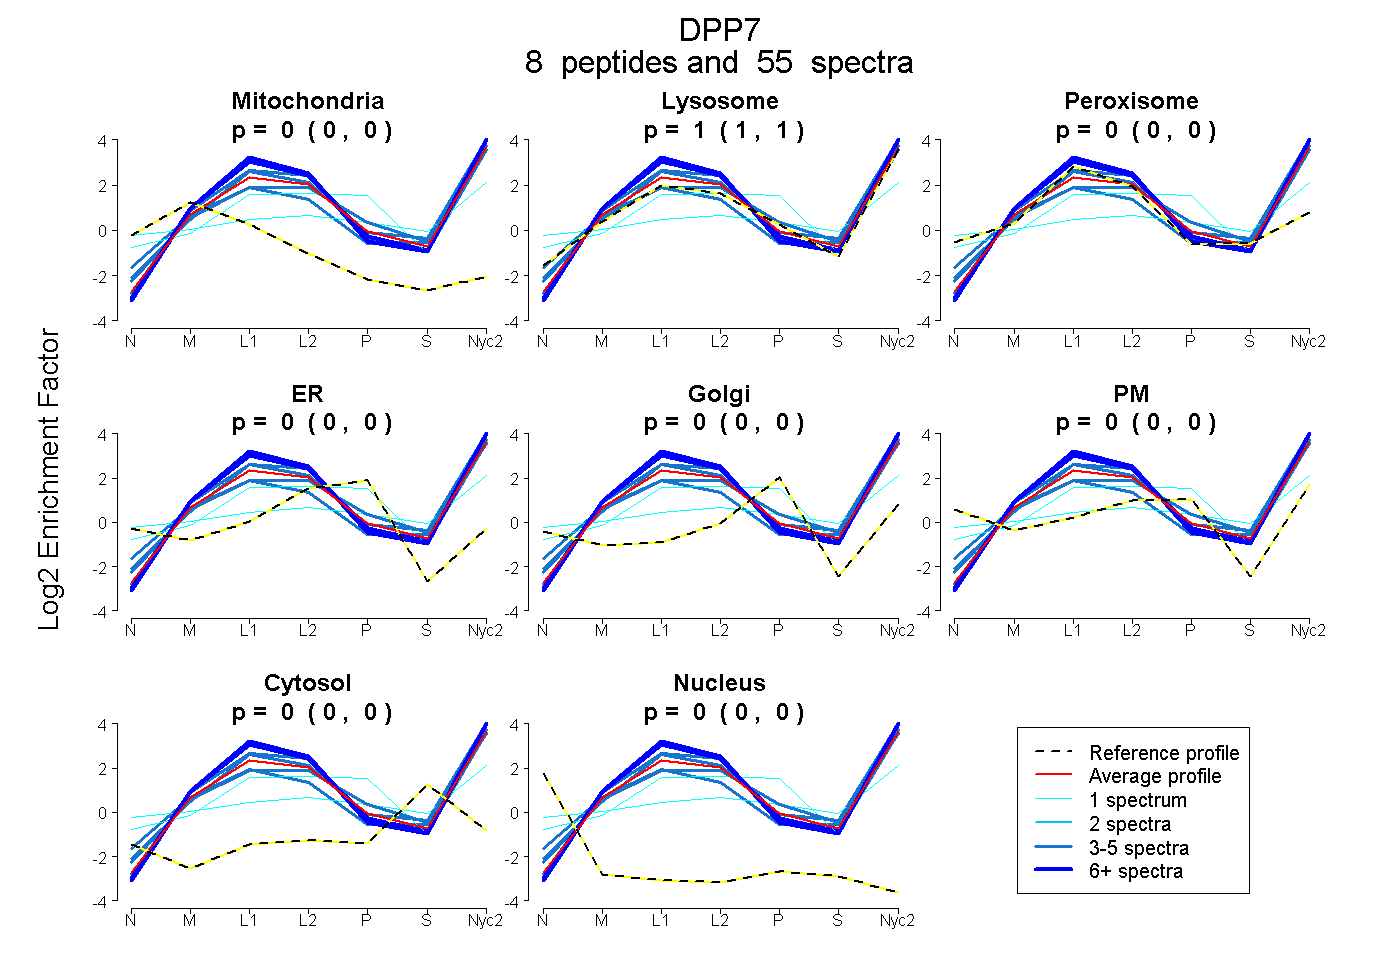 |
0.000
0.000 | 0.000 |
1.000
1.000 | 1.000 |
|
0.000
0.000 | 0.000 |
0.000
0.000 | 0.000 |
0.000
0.000 | 0.000 |
0.000
0.000 | 0.000 |
0.000
0.000 | 0.000 |
0.000
0.000 | 0.000 |
|
| | | Plot |
Mito |
|
Lyso or Perox |
|
ER |
Golgi |
PM |
Cytosol |
Nucleus |
|
| Expt B |
6
peptides |
18
spectra |
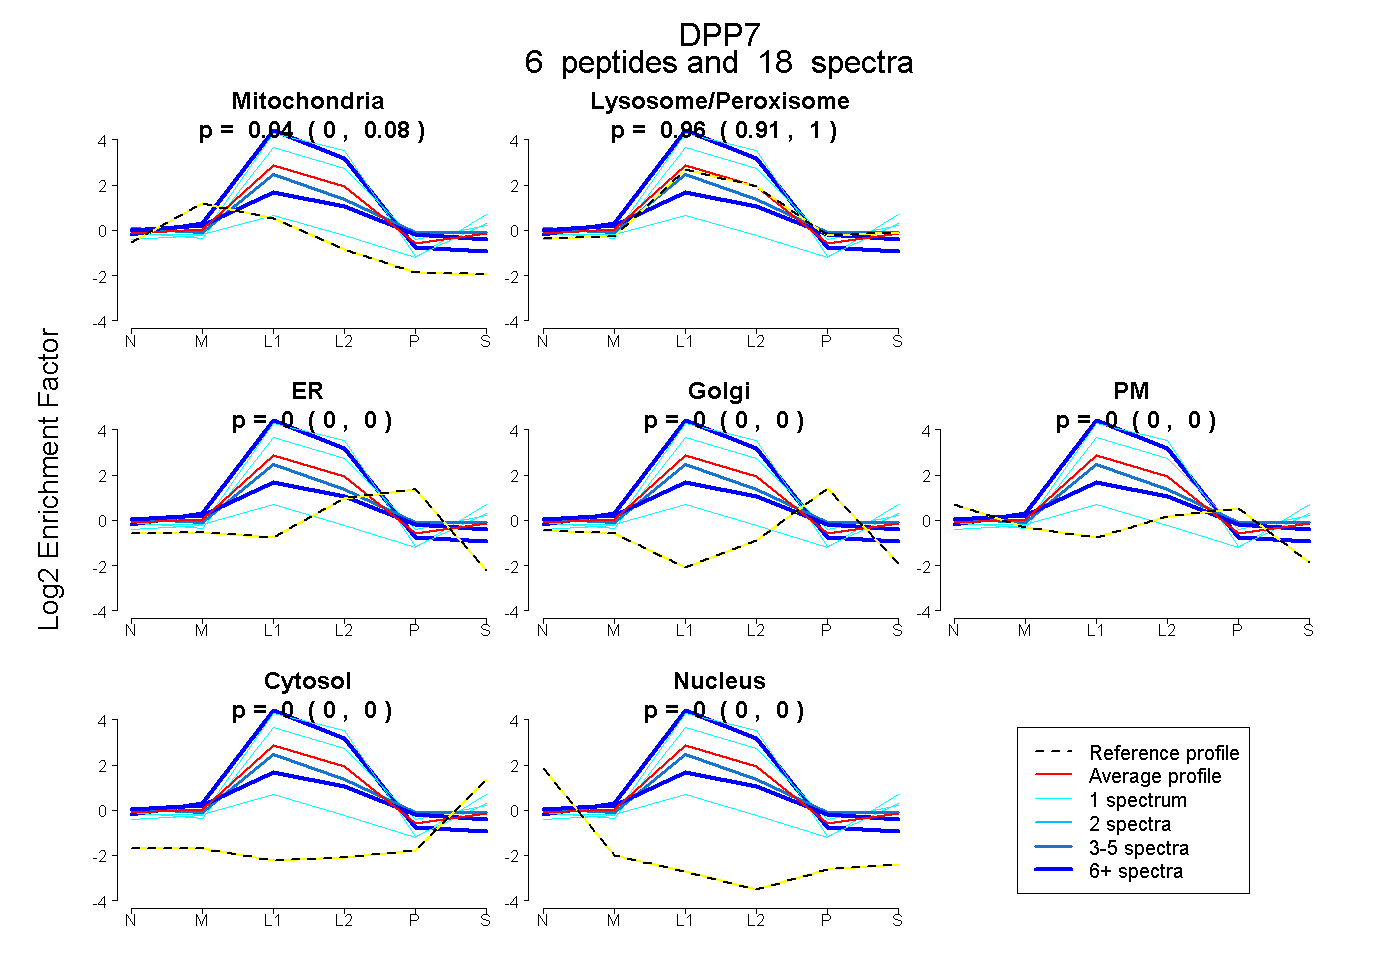 |
0.035
0.000 | 0.077 |
|
0.965
0.914 | 1.000 |
|
0.000
0.000 | 0.000 |
0.000
0.000 | 0.000 |
0.000
0.000 | 0.000 |
0.000
0.000 | 0.000 |
0.000
0.000 | 0.000 |
|
| 1 spectrum, DVTADFYGQSPK |
0.000 |
|
1.000 |
|
0.000 |
0.000 |
0.000 |
0.000 |
0.000 |
|
| 6 spectra, SLPFGVQSTQR |
0.144 |
|
0.654 |
|
0.000 |
0.000 |
0.193 |
0.008 |
0.000 |
|
| 1 spectrum, FLVSDK |
0.000 |
|
1.000 |
|
0.000 |
0.000 |
0.000 |
0.000 |
0.000 |
|
| 1 spectrum, DAFQQIK |
0.129 |
|
0.489 |
|
0.000 |
0.000 |
0.000 |
0.346 |
0.035 |
|
| 3 spectra, LLSEGQR |
0.018 |
|
0.893 |
|
0.000 |
0.000 |
0.060 |
0.000 |
0.029 |
|
| 6 spectra, DLTQLFGFAR |
0.000 |
|
1.000 |
|
0.000 |
0.000 |
0.000 |
0.000 |
0.000 |
|
| | | Plot |
|
Lyso |
|
|
|
|
|
|
|
Other |
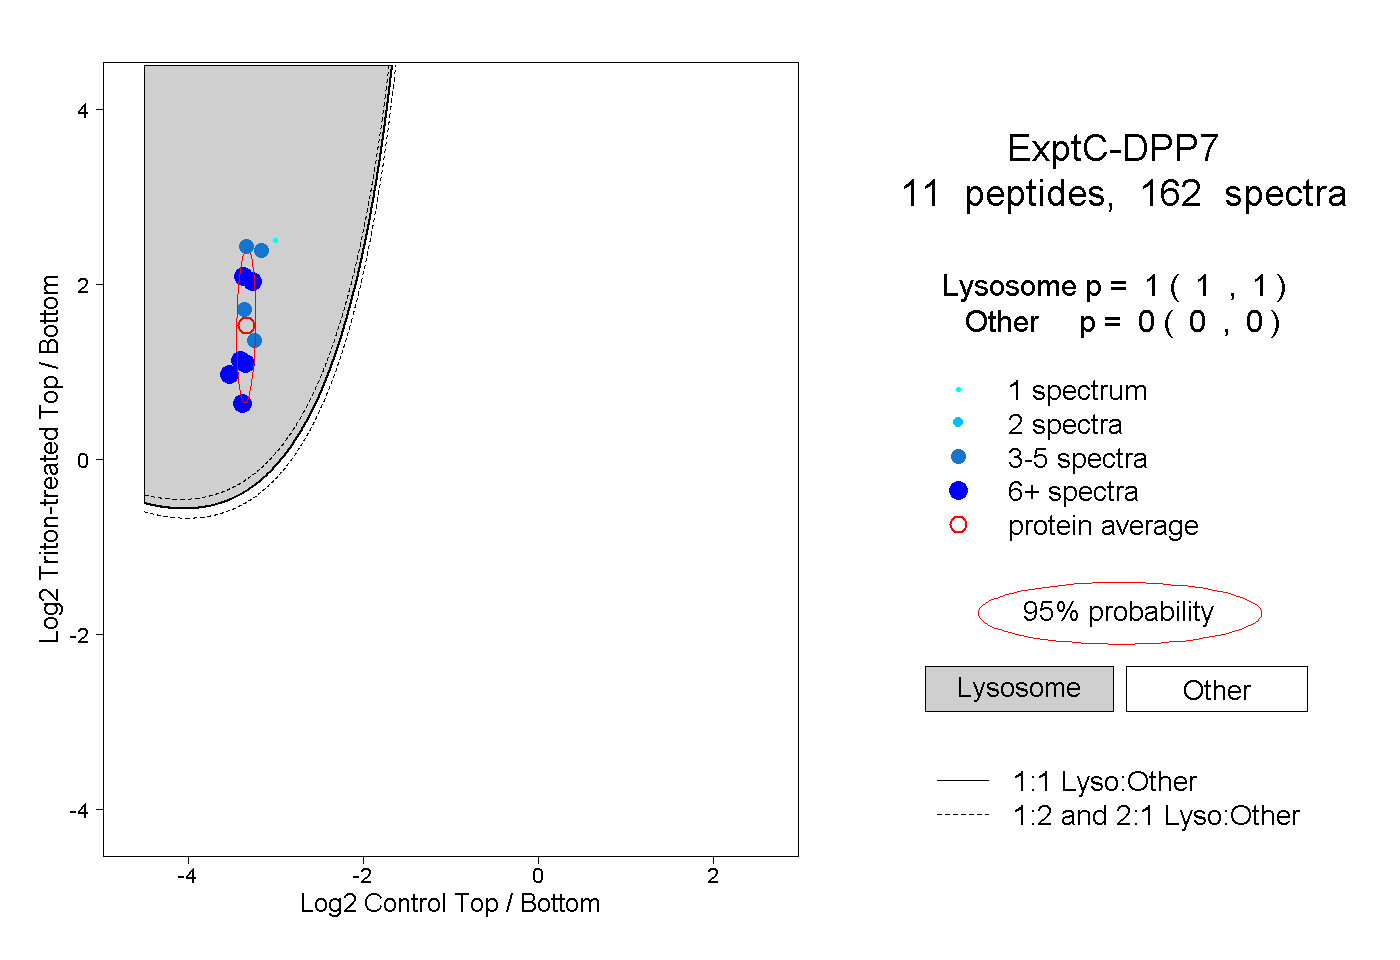
| Expt C |
11
peptides |
162
spectra |
 |
|
1.000
1.000 | 1.000 |
|
|
|
|
|
|
|
0.000
0.000 | 0.000 |
| | | Plot |
|
Lyso |
|
|
|
|
|
|
|
Other |
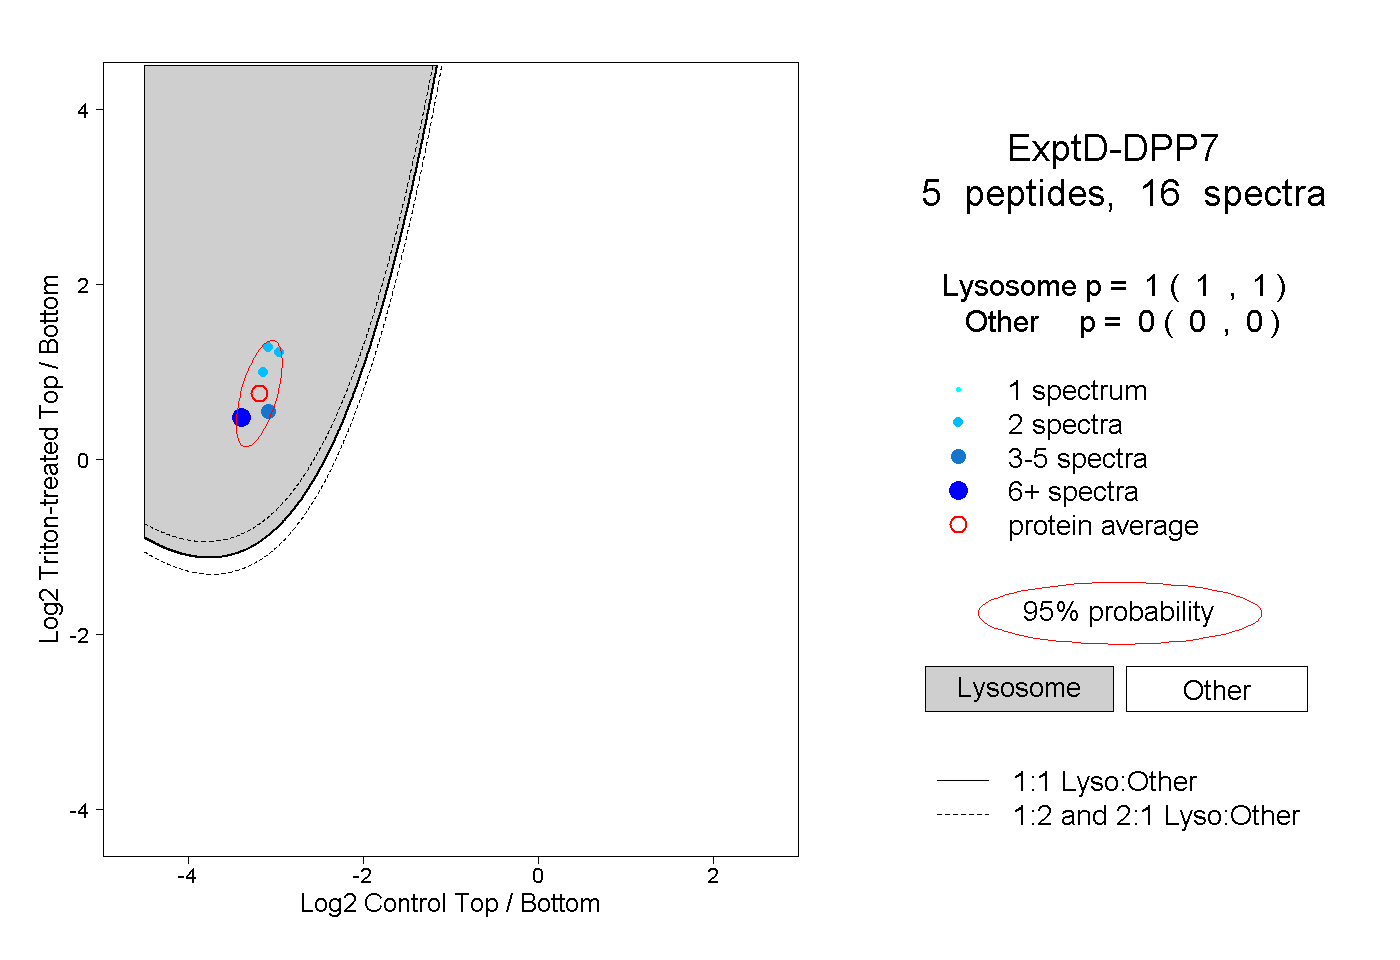
| Expt D |
5
peptides |
16
spectra |
 |
|
1.000
1.000 | 1.000 |
|
|
|
|
|
|
|
0.000
0.000 | 0.000 |