 3
3peptides
spectra
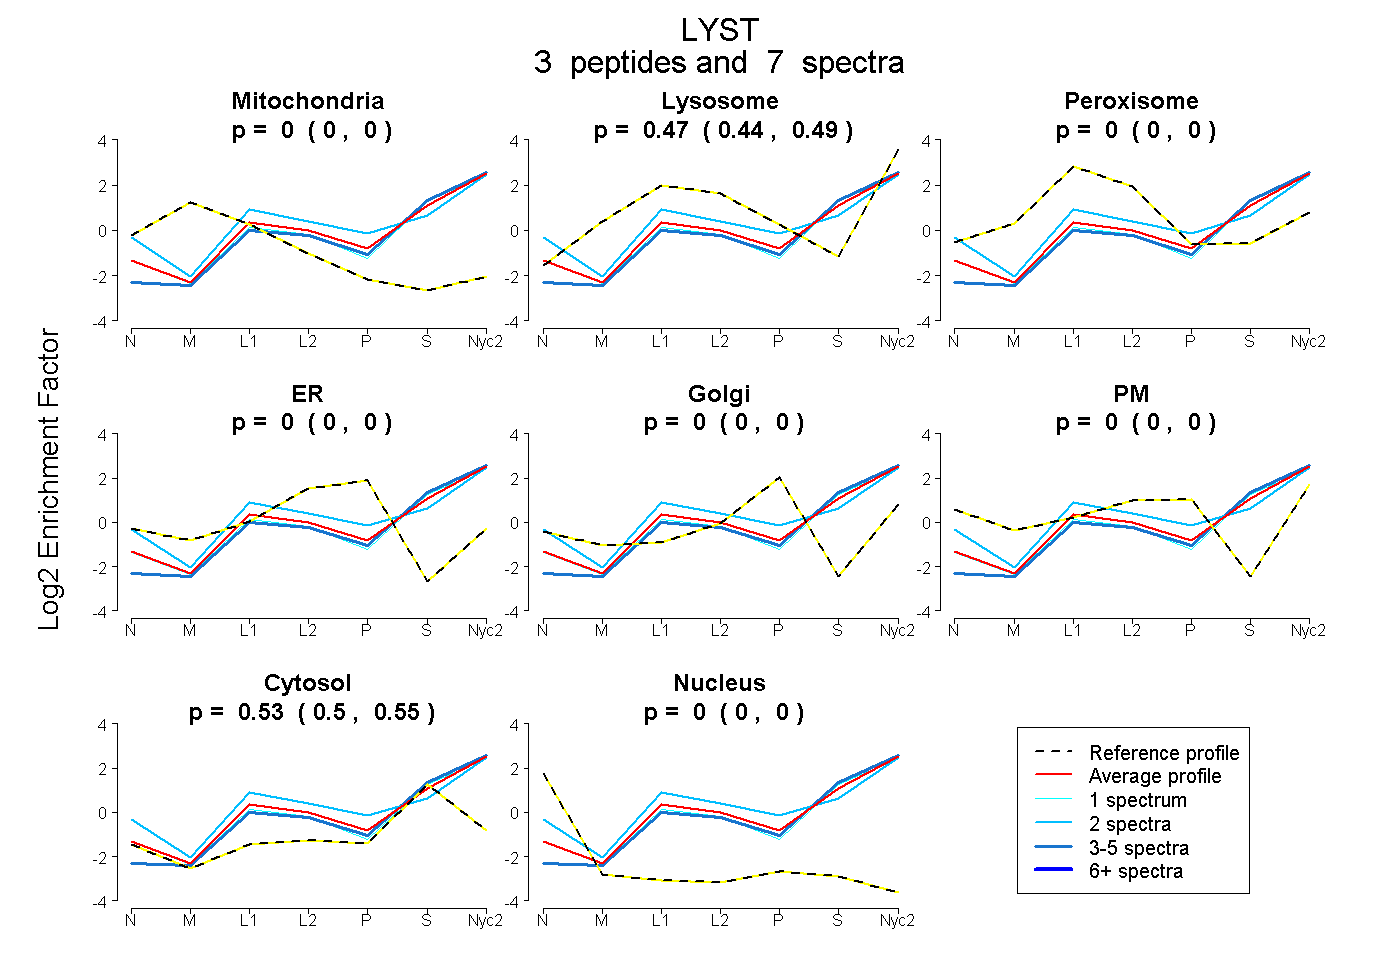
0.000 | 0.000
0.443 | 0.492
0.000 | 0.000
0.000 | 0.000
0.000 | 0.000
0.000 | 0.000
0.505 | 0.552
0.000 | 0.000
| Plot | Mito | Lyso | Perox | ER | Golgi | PM | Cytosol | Nucleus | |||||
| Expt A |
3 peptides |
7 spectra |
|
0.000 0.000 | 0.000 |
0.469 0.443 | 0.492 |
0.000 0.000 | 0.000 |
0.000 0.000 | 0.000 |
0.000 0.000 | 0.000 |
0.000 0.000 | 0.000 |
0.531 0.505 | 0.552 |
0.000 0.000 | 0.000 |
| 4 spectra, LIILAVNR | 0.000 | 0.417 | 0.000 | 0.000 | 0.000 | 0.000 | 0.583 | 0.000 | ||
| 2 spectra, VALGNHSADLDPGDTVTEK | 0.000 | 0.538 | 0.000 | 0.000 | 0.000 | 0.045 | 0.418 | 0.000 | ||
| 1 spectrum, AEGDRPEVTESISPSDR | 0.000 | 0.419 | 0.000 | 0.000 | 0.000 | 0.000 | 0.581 | 0.000 |
| Plot | Lyso | Other | |||||||||||
| Expt C |
7 peptides |
10 spectra |
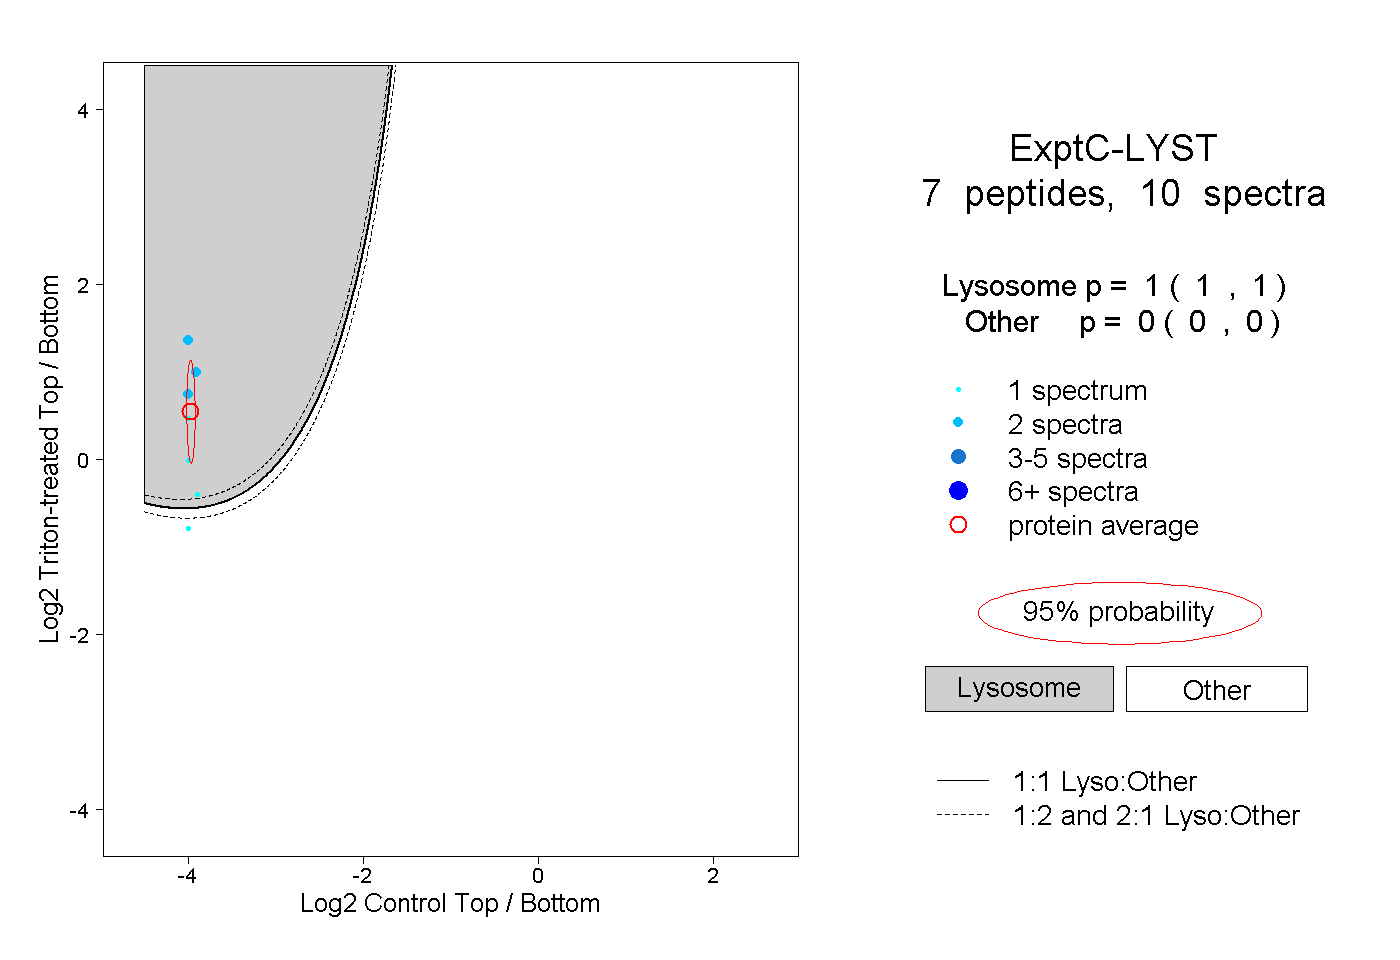 |
1.000 1.000 | 1.000 |
0.000 0.000 | 0.000 |