16
16peptides
spectra
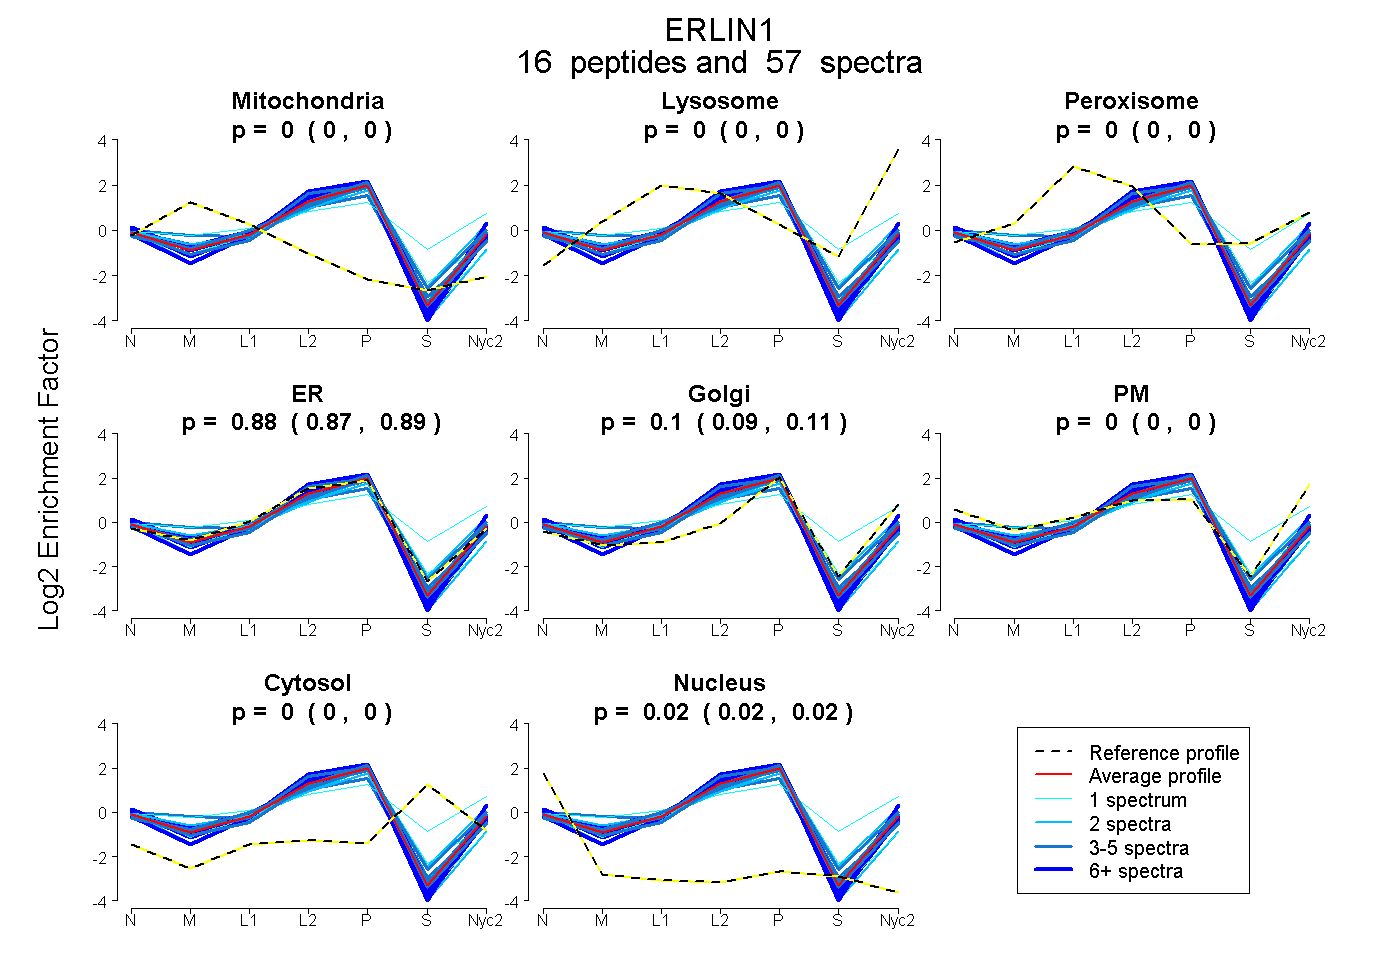
0.000 | 0.000
0.000 | 0.000
0.000 | 0.000
0.871 | 0.886
0.091 | 0.107
0.000 | 0.000
0.000 | 0.000
0.019 | 0.023
4peptides
spectra
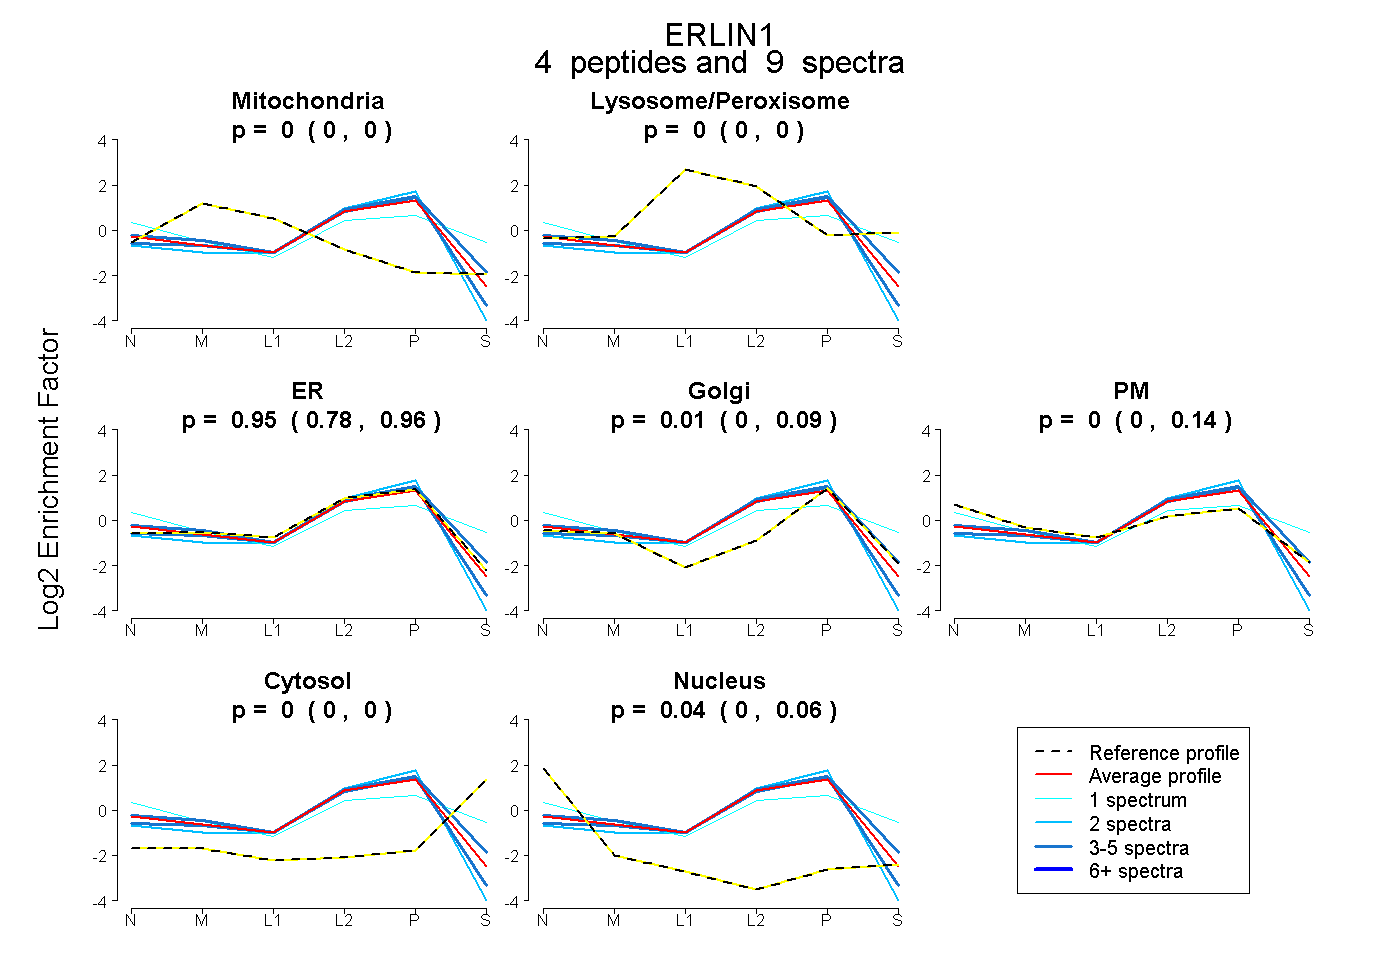
0.000 | 0.000
0.000 | 0.000
0.780 | 0.959
0.000 | 0.085
0.000 | 0.139
0.000 | 0.000
0.000 | 0.055