 16
16peptides
spectra
0.000 | 0.000
0.000 | 0.000
0.000 | 0.000
0.871 | 0.886
0.091 | 0.107
0.000 | 0.000
0.000 | 0.000
0.019 | 0.023
| Plot | Mito | Lyso | Perox | ER | Golgi | PM | Cytosol | Nucleus | |||||
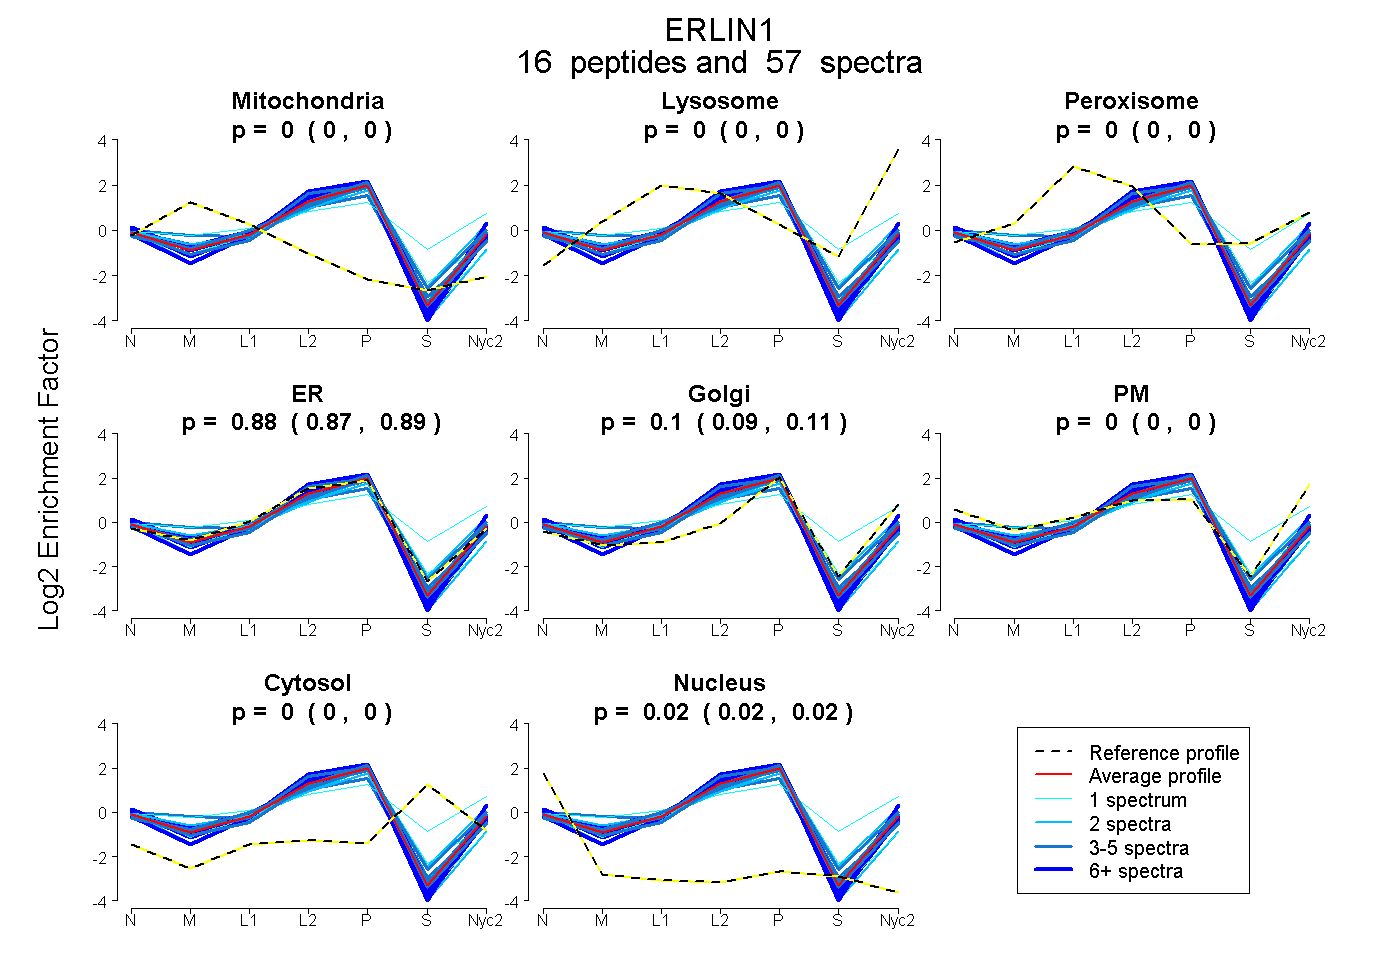
| Expt A |
16 peptides |
57 spectra |
|
0.000 0.000 | 0.000 |
0.000 0.000 | 0.000 |
0.000 0.000 | 0.000 |
0.879 0.871 | 0.886 |
0.100 0.091 | 0.107 |
0.000 0.000 | 0.000 |
0.000 0.000 | 0.000 |
0.021 0.019 | 0.023 |
| 1 spectrum, IYFGSNIPNMFVDSSCALK | 0.000 | 0.000 | 0.000 | 0.939 | 0.000 | 0.000 | 0.000 | 0.061 | ||
| 4 spectra, TLIFNK | 0.000 | 0.000 | 0.000 | 0.879 | 0.076 | 0.000 | 0.000 | 0.045 | ||
| 2 spectra, IPEAIR | 0.000 | 0.000 | 0.000 | 0.949 | 0.000 | 0.000 | 0.000 | 0.051 | ||
| 3 spectra, DLNTMAPGLTIQAVR | 0.112 | 0.000 | 0.000 | 0.665 | 0.111 | 0.112 | 0.000 | 0.000 | ||
| 2 spectra, SVQTTLQTDEVK | 0.044 | 0.000 | 0.000 | 0.705 | 0.162 | 0.070 | 0.000 | 0.019 | ||
| 6 spectra, ISEIEDAAFLAR | 0.000 | 0.000 | 0.000 | 0.969 | 0.000 | 0.000 | 0.000 | 0.031 | ||
| 10 spectra, NFELMEAEK | 0.000 | 0.000 | 0.000 | 0.990 | 0.000 | 0.000 | 0.000 | 0.010 | ||
| 2 spectra, AVIEAEK | 0.000 | 0.000 | 0.000 | 0.915 | 0.063 | 0.000 | 0.000 | 0.022 | ||
| 1 spectrum, LTPEYLELK | 0.000 | 0.000 | 0.000 | 0.869 | 0.073 | 0.000 | 0.034 | 0.024 | ||
| 3 spectra, YQAIASNSK | 0.003 | 0.000 | 0.024 | 0.727 | 0.247 | 0.000 | 0.000 | 0.000 | ||
| 6 spectra, MNMTQAR | 0.000 | 0.000 | 0.000 | 0.920 | 0.078 | 0.000 | 0.000 | 0.002 | ||
| 2 spectra, IEEGHLAVYYR | 0.000 | 0.000 | 0.015 | 0.566 | 0.369 | 0.050 | 0.000 | 0.000 | ||
| 1 spectrum, NVPCGTSGGVMIYIDR | 0.000 | 0.000 | 0.283 | 0.035 | 0.403 | 0.182 | 0.097 | 0.000 | ||
| 4 spectra, ADAEYYAAHK | 0.000 | 0.000 | 0.000 | 0.902 | 0.042 | 0.000 | 0.000 | 0.056 | ||
| 7 spectra, LLIAAQK | 0.000 | 0.000 | 0.000 | 0.799 | 0.016 | 0.185 | 0.000 | 0.000 | ||
| 3 spectra, YATSNK | 0.000 | 0.000 | 0.000 | 0.944 | 0.043 | 0.014 | 0.000 | 0.000 |
| Plot | Mito | Lyso or Perox | ER | Golgi | PM | Cytosol | Nucleus | ||||||
| Expt B |
4 peptides |
9 spectra |
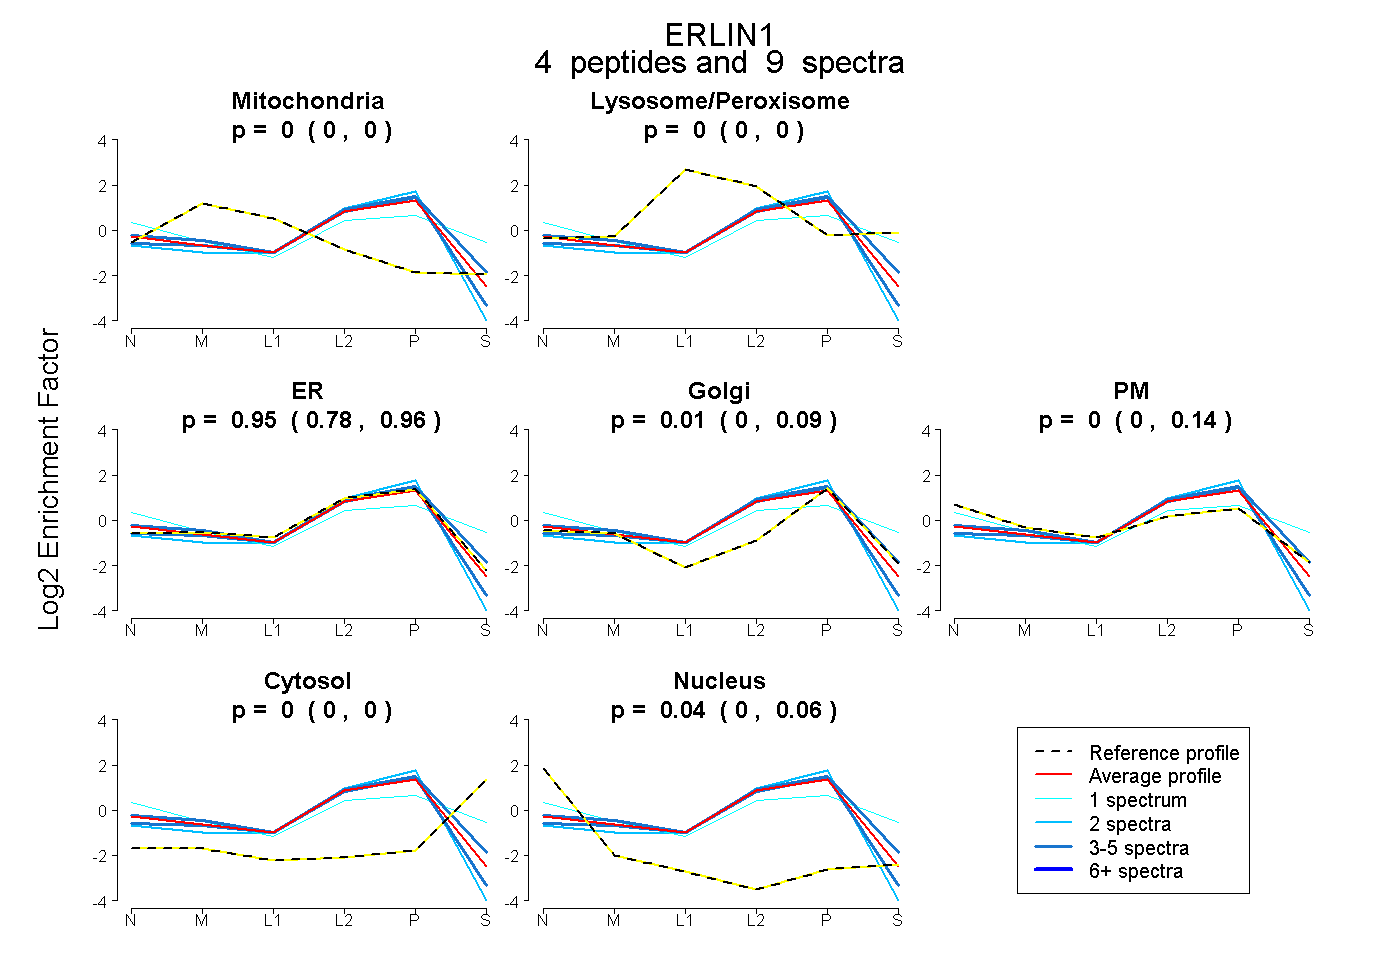 |
0.000 0.000 | 0.000 |
0.000 0.000 | 0.000 |
0.947 0.780 | 0.959 |
0.013 0.000 | 0.085 |
0.000 0.000 | 0.139 |
0.000 0.000 | 0.000 |
0.041 0.000 | 0.055 |
|||
| Plot | Lyso | Other | |||||||||||
| Expt C |
10 peptides |
66 spectra |
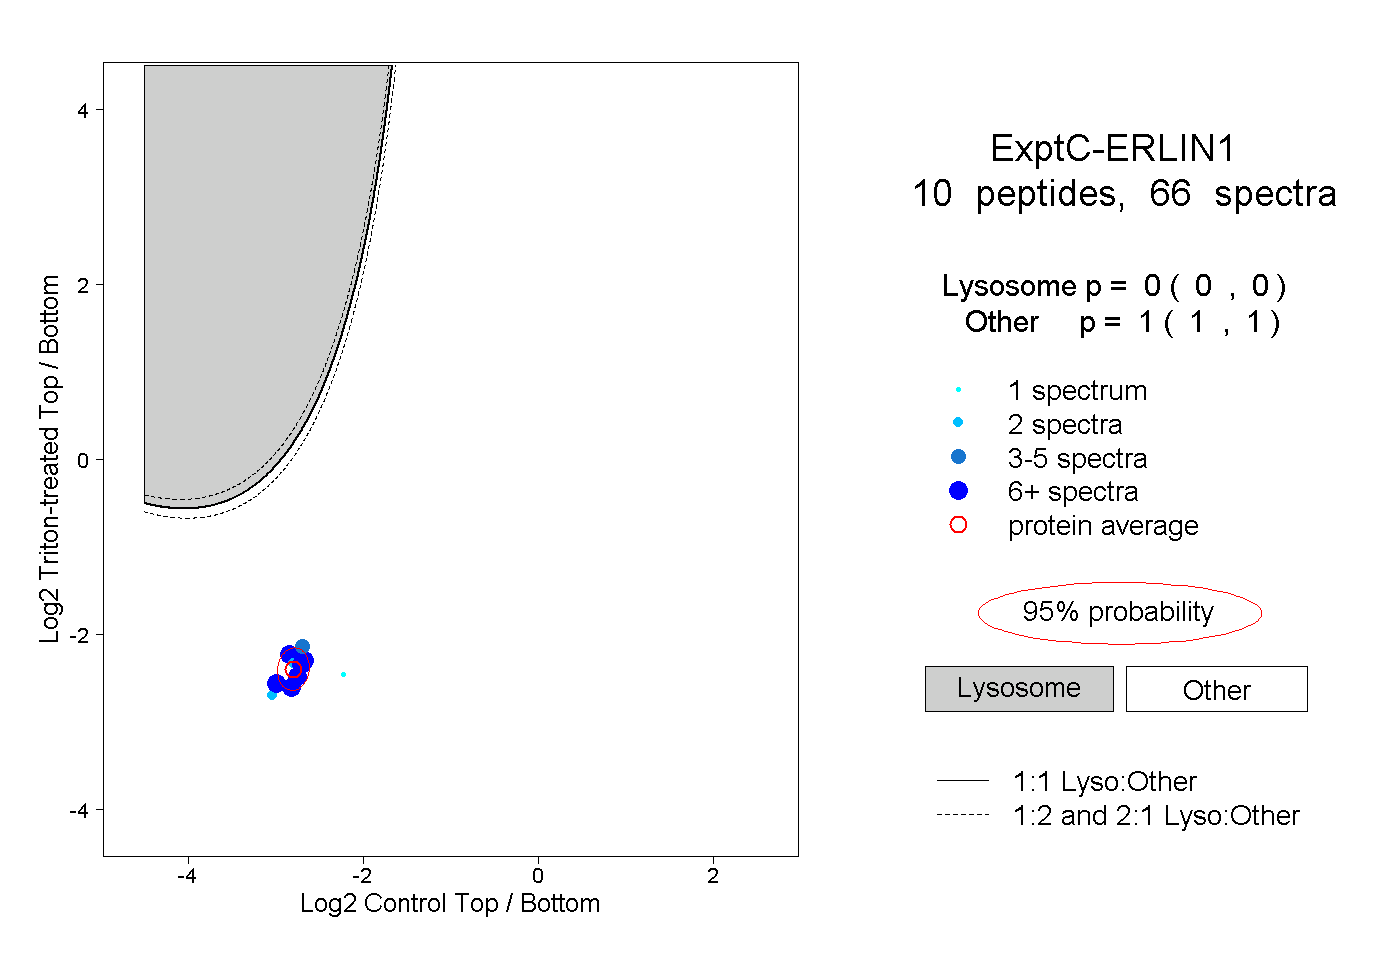 |
0.000 0.000 | 0.000 |
1.000 1.000 | 1.000 |
||||||||
| Plot | Lyso | Other | |||||||||||
| Expt D |
7 peptides |
13 spectra |
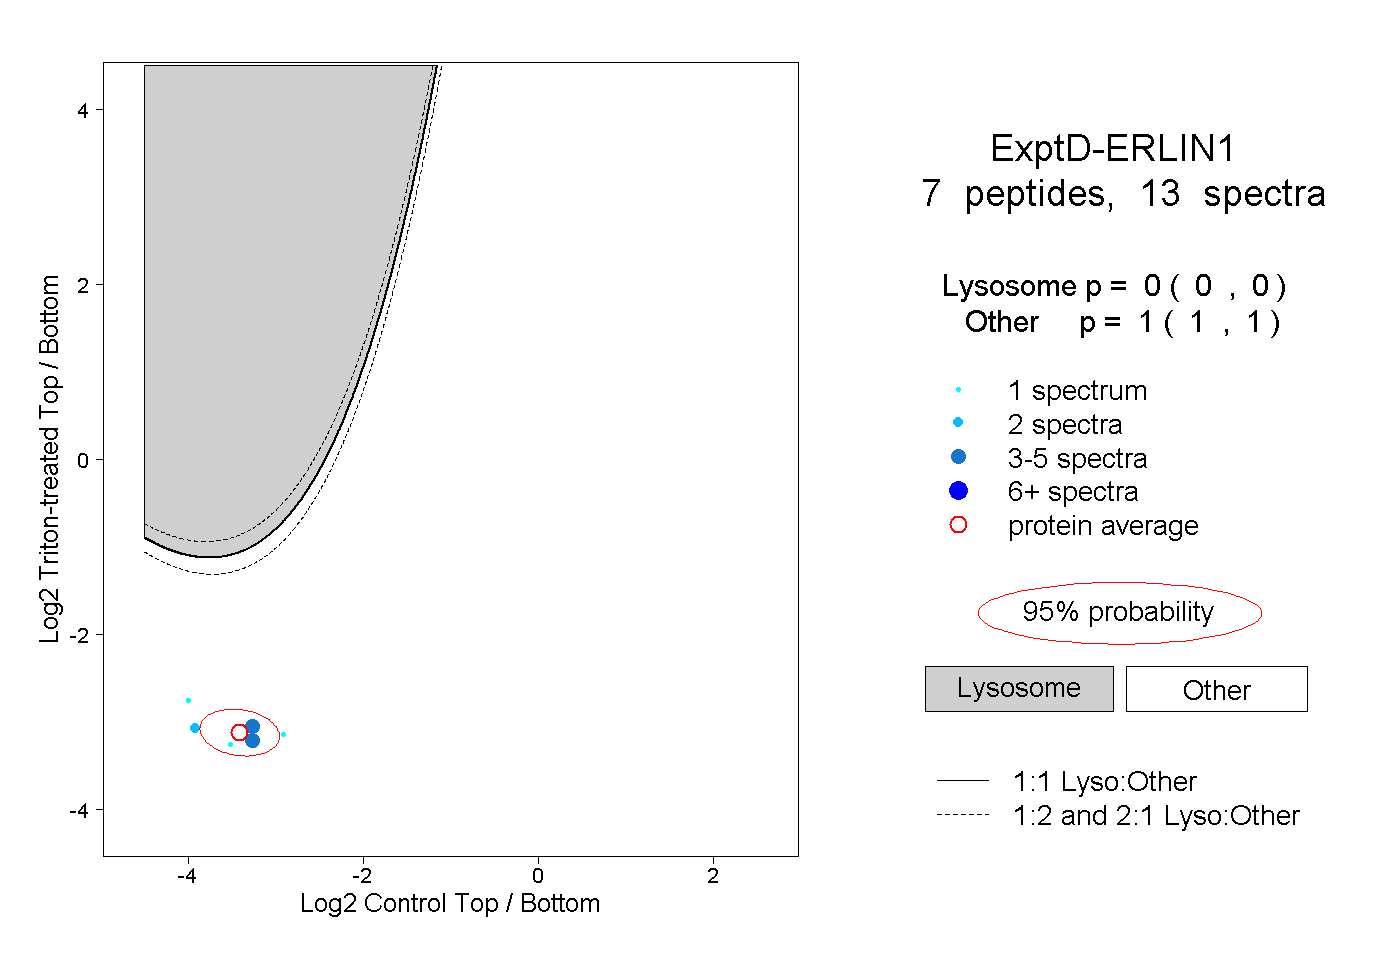 |
0.000 0.000 | 0.000 |
1.000 1.000 | 1.000 |