 6
6peptides
spectra
0.000 | 0.000
0.000 | 0.000
0.000 | 0.000
0.257 | 0.268
0.000 | 0.000
0.000 | 0.000
0.628 | 0.640
0.095 | 0.110
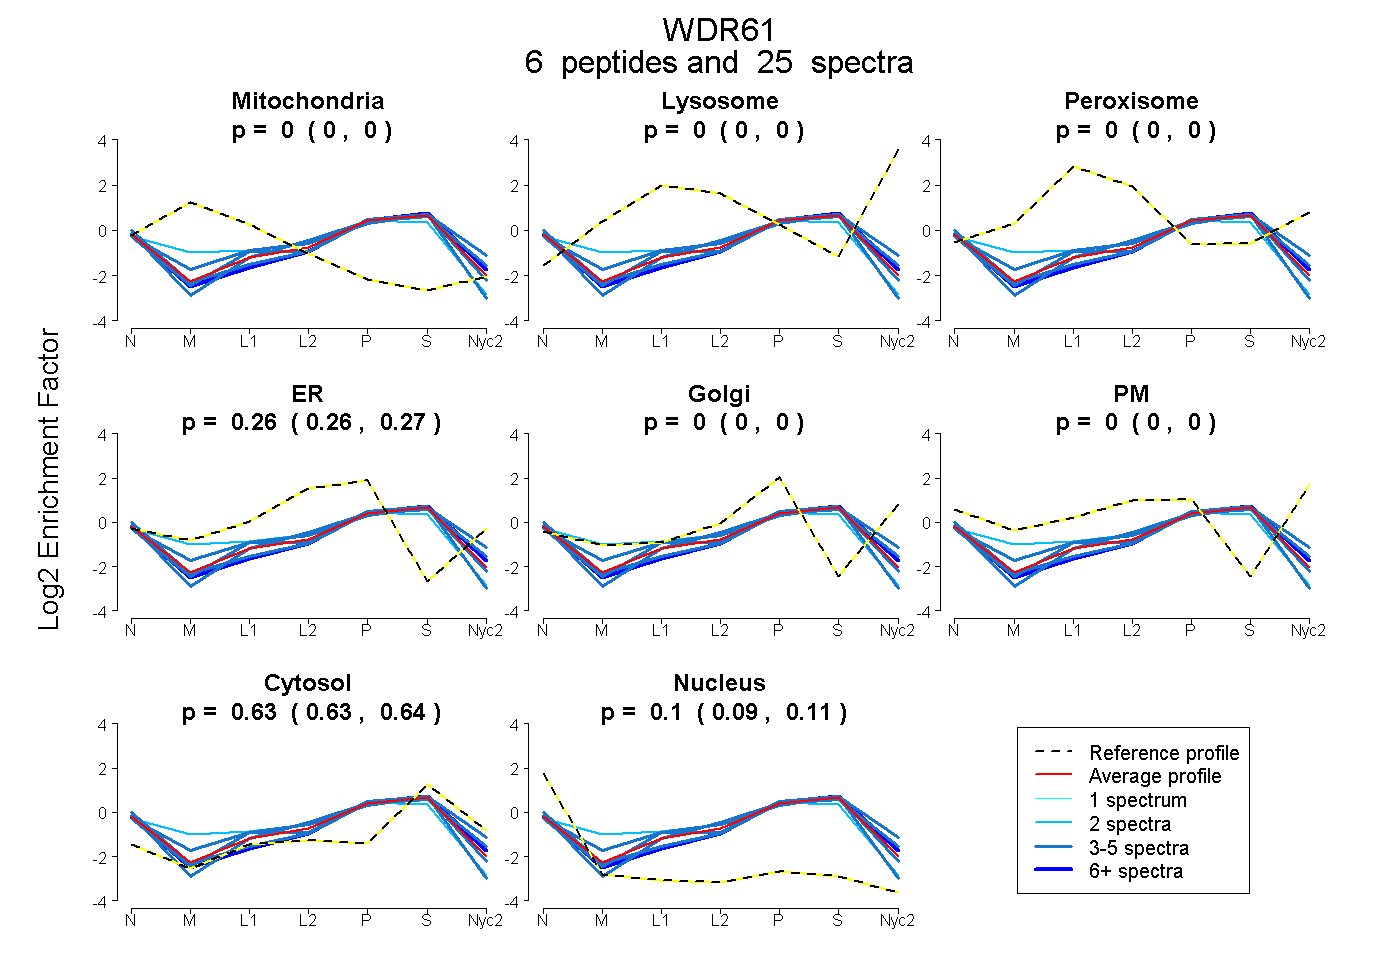
| Plot | Mito | Lyso | Perox | ER | Golgi | PM | Cytosol | Nucleus | |||||
| Expt A |
6 peptides |
25 spectra |
|
0.000 0.000 | 0.000 |
0.000 0.000 | 0.000 |
0.000 0.000 | 0.000 |
0.263 0.257 | 0.268 |
0.000 0.000 | 0.000 |
0.000 0.000 | 0.000 |
0.634 0.628 | 0.640 |
0.103 0.095 | 0.110 |
| 2 spectra, FILSIAYSPDGK | 0.116 | 0.000 | 0.000 | 0.299 | 0.000 | 0.000 | 0.495 | 0.090 | ||
| 8 spectra, EYSLDTR | 0.000 | 0.000 | 0.000 | 0.218 | 0.007 | 0.000 | 0.669 | 0.107 | ||
| 3 spectra, VWDVGTR | 0.000 | 0.000 | 0.000 | 0.204 | 0.055 | 0.000 | 0.625 | 0.116 | ||
| 4 spectra, LLHTLEGHAMPIR | 0.000 | 0.000 | 0.000 | 0.249 | 0.000 | 0.000 | 0.639 | 0.112 | ||
| 4 spectra, VNIFGVESGK | 0.000 | 0.000 | 0.000 | 0.318 | 0.000 | 0.000 | 0.672 | 0.010 | ||
| 4 spectra, TCIHTFFDHQDQVWGVK | 0.000 | 0.000 | 0.000 | 0.230 | 0.000 | 0.000 | 0.614 | 0.157 |
| Plot | Mito | Lyso or Perox | ER | Golgi | PM | Cytosol | Nucleus | ||||||
| Expt B |
4 peptides |
5 spectra |
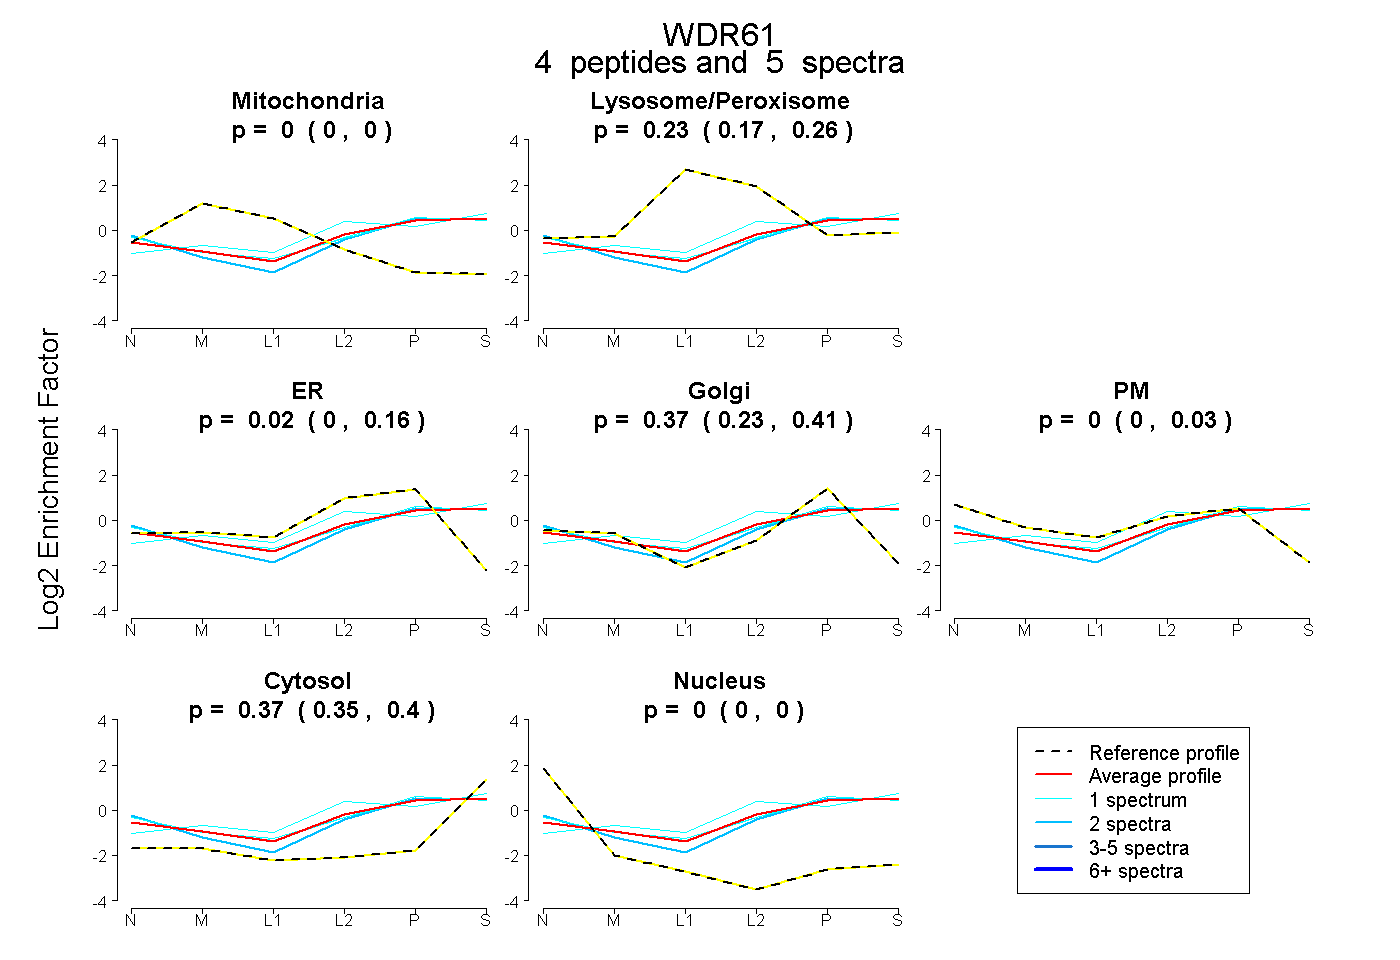 |
0.000 0.000 | 0.000 |
0.234 0.172 | 0.259 |
0.024 0.000 | 0.159 |
0.374 0.227 | 0.406 |
0.000 0.000 | 0.034 |
0.368 0.346 | 0.402 |
0.000 0.000 | 0.000 |
|||
| Plot | Lyso | Other | |||||||||||
| Expt C |
3 peptides |
7 spectra |
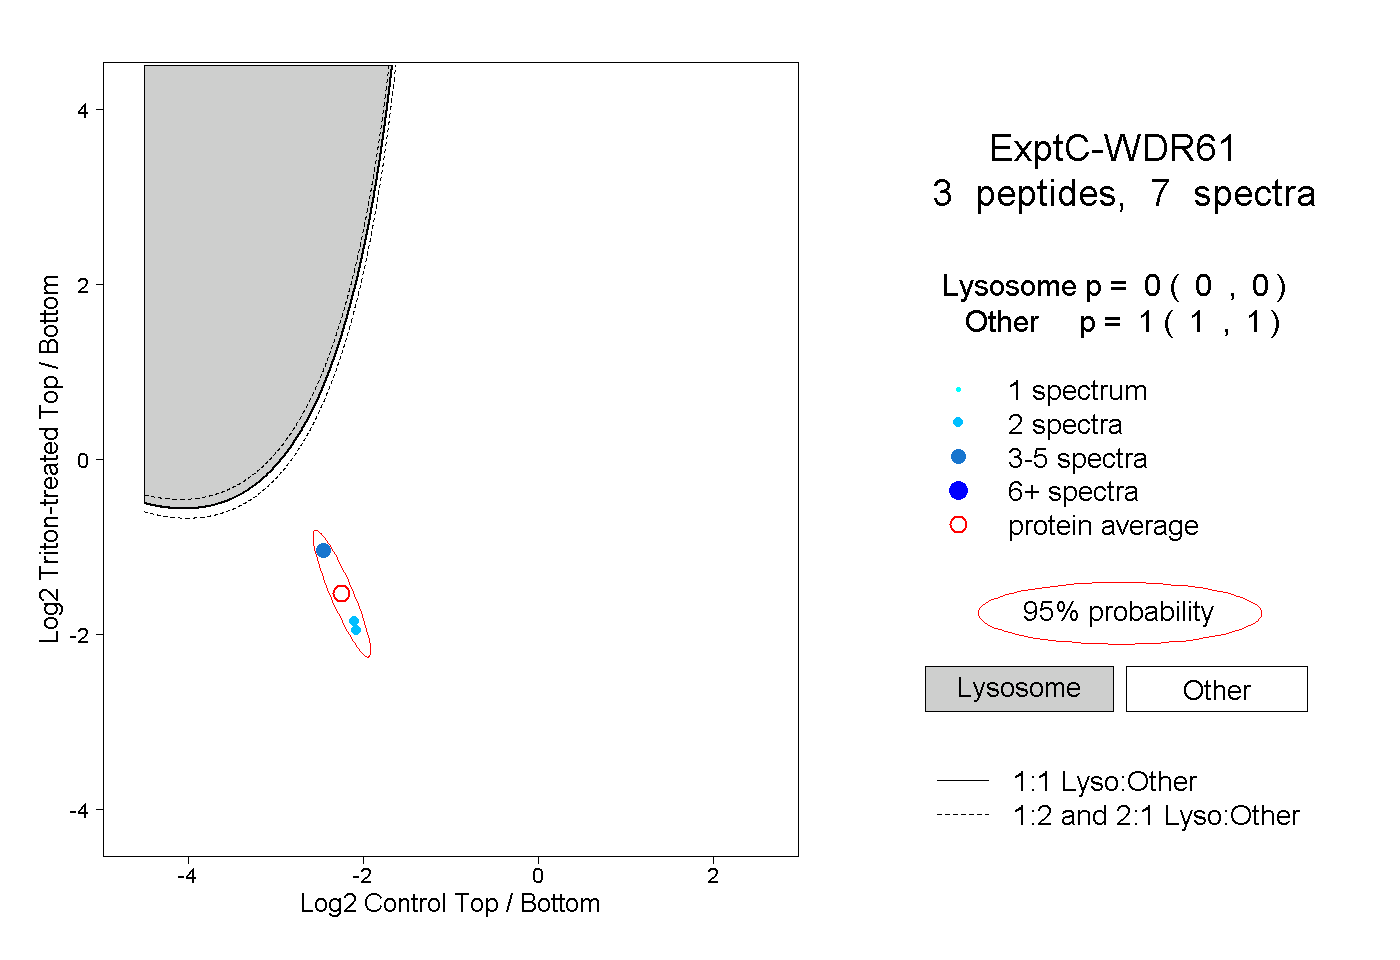 |
0.000 0.000 | 0.000 |
1.000 1.000 | 1.000 |
||||||||
| Plot | Lyso | Other | |||||||||||
| Expt D |
1 peptide |
4 spectra |
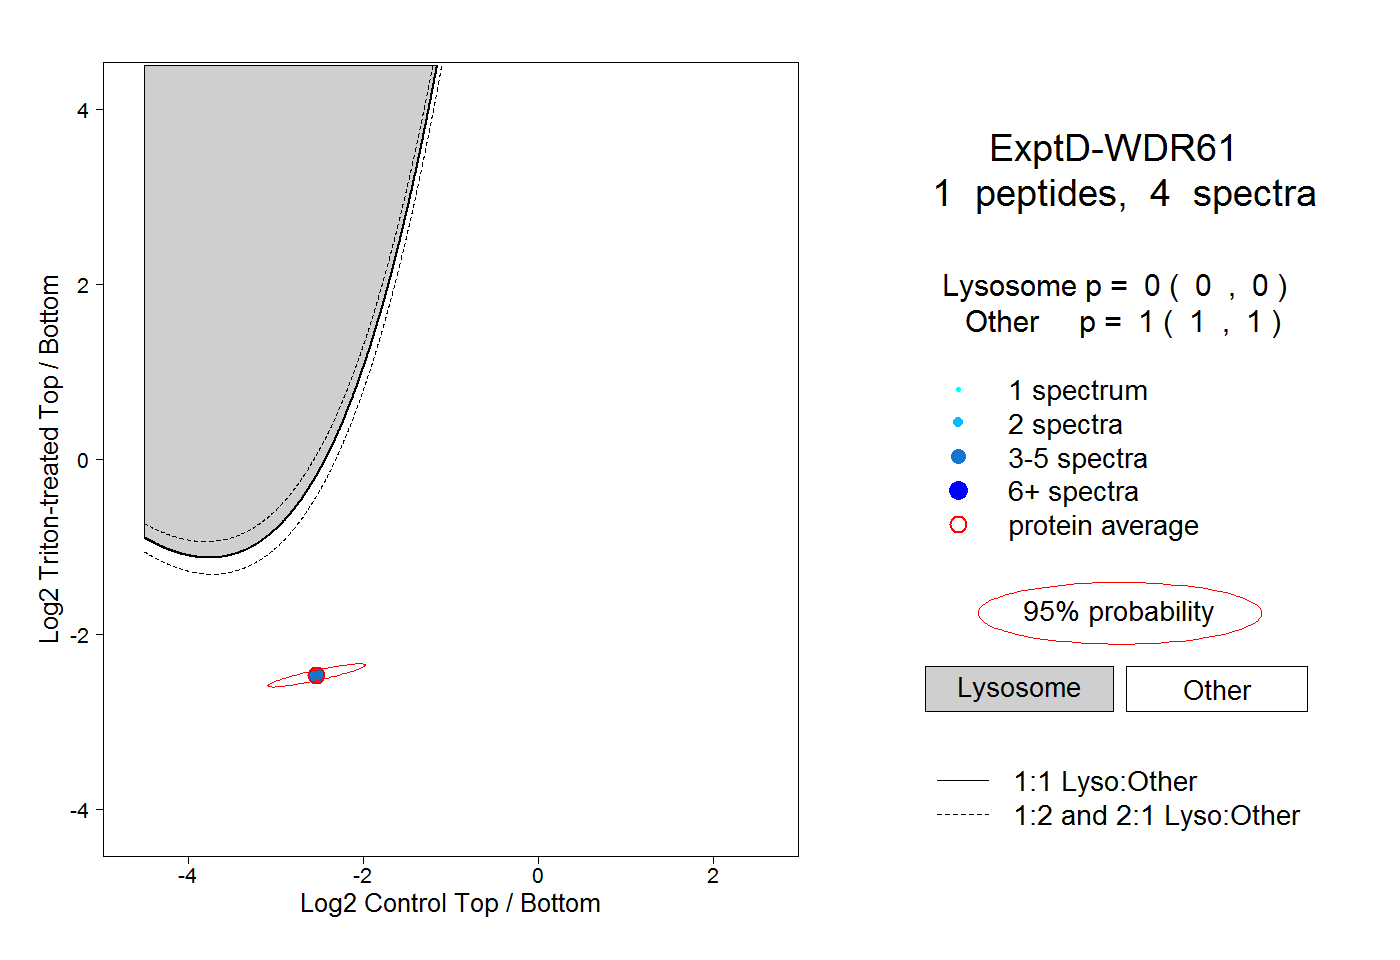 |
0.000 0.000 | 0.000 |
1.000 1.000 | 1.000 |