 17
17peptides
spectra
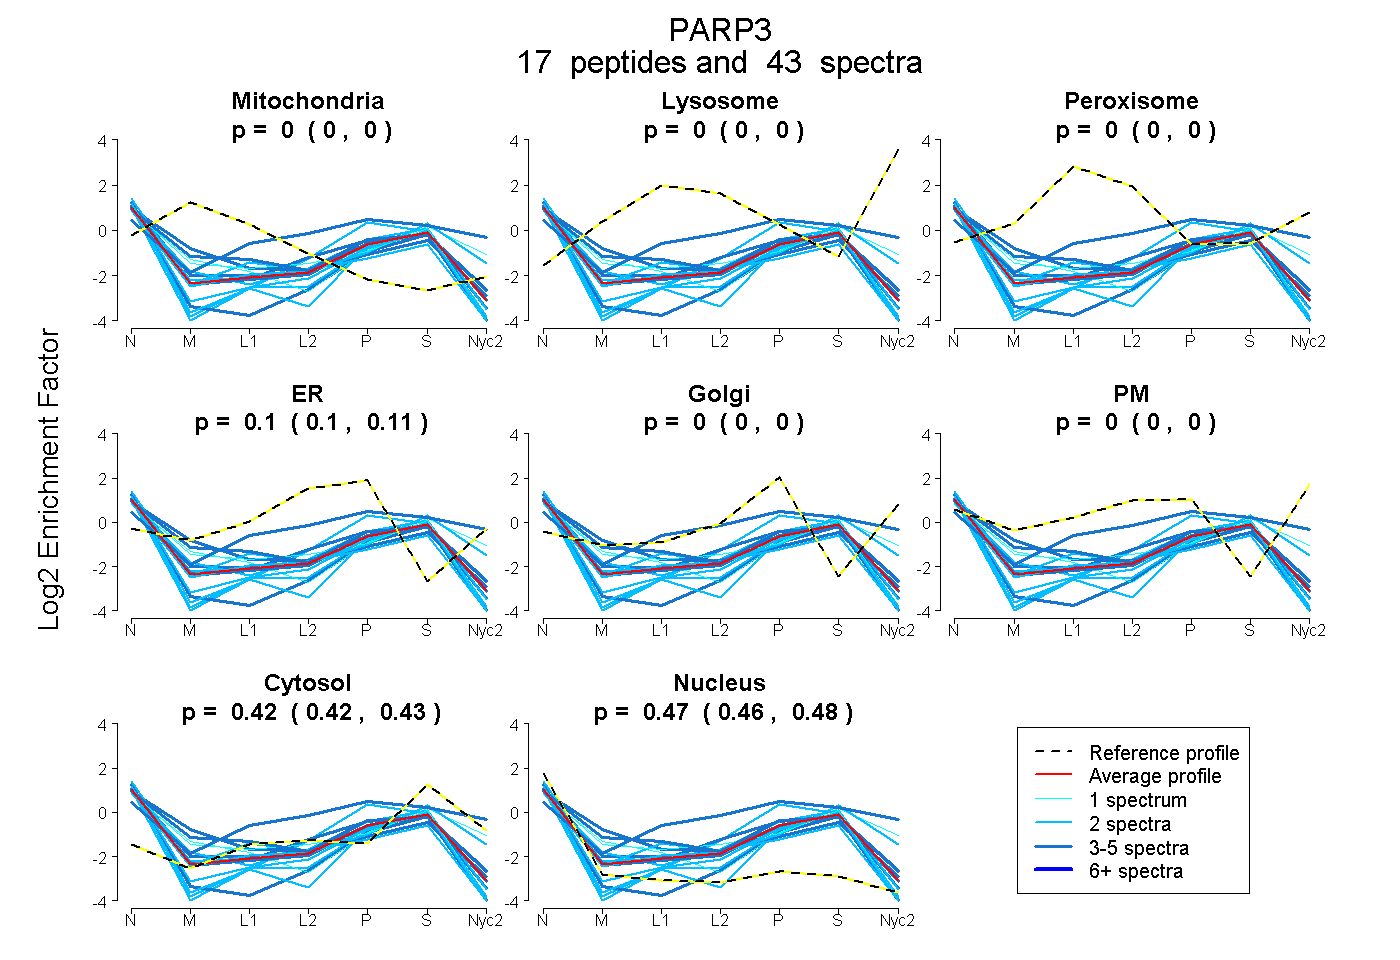
0.000 | 0.000
0.000 | 0.000
0.000 | 0.000
0.098 | 0.110
0.000 | 0.000
0.000 | 0.000
0.419 | 0.429
0.464 | 0.477
4peptides
spectra
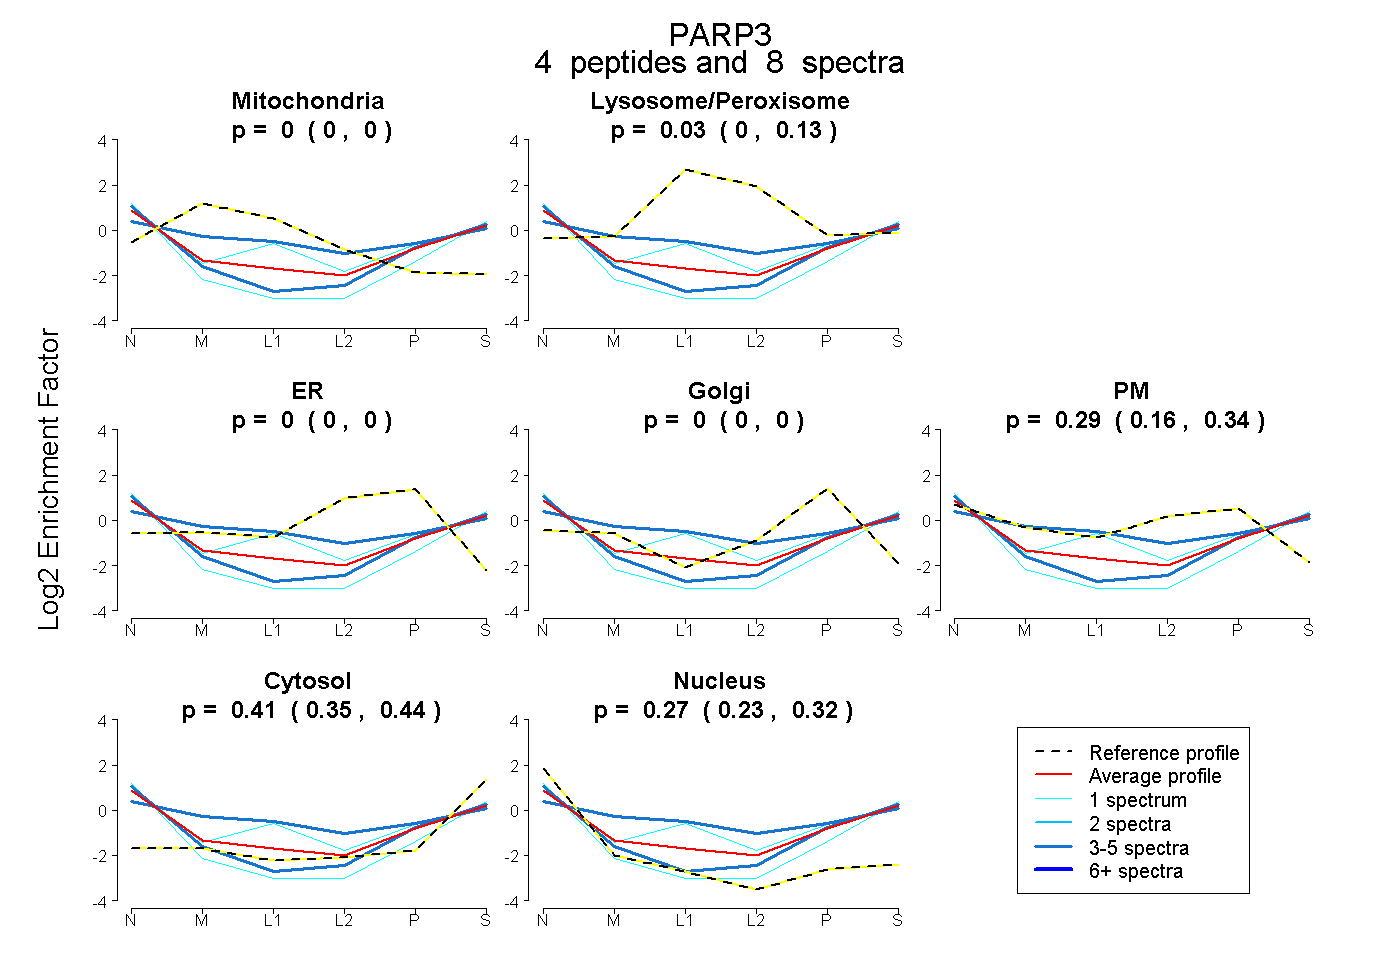
0.000 | 0.000
0.000 | 0.127
0.000 | 0.000
0.000 | 0.000
0.162 | 0.337
0.354 | 0.439
0.226 | 0.325
9peptides
spectra
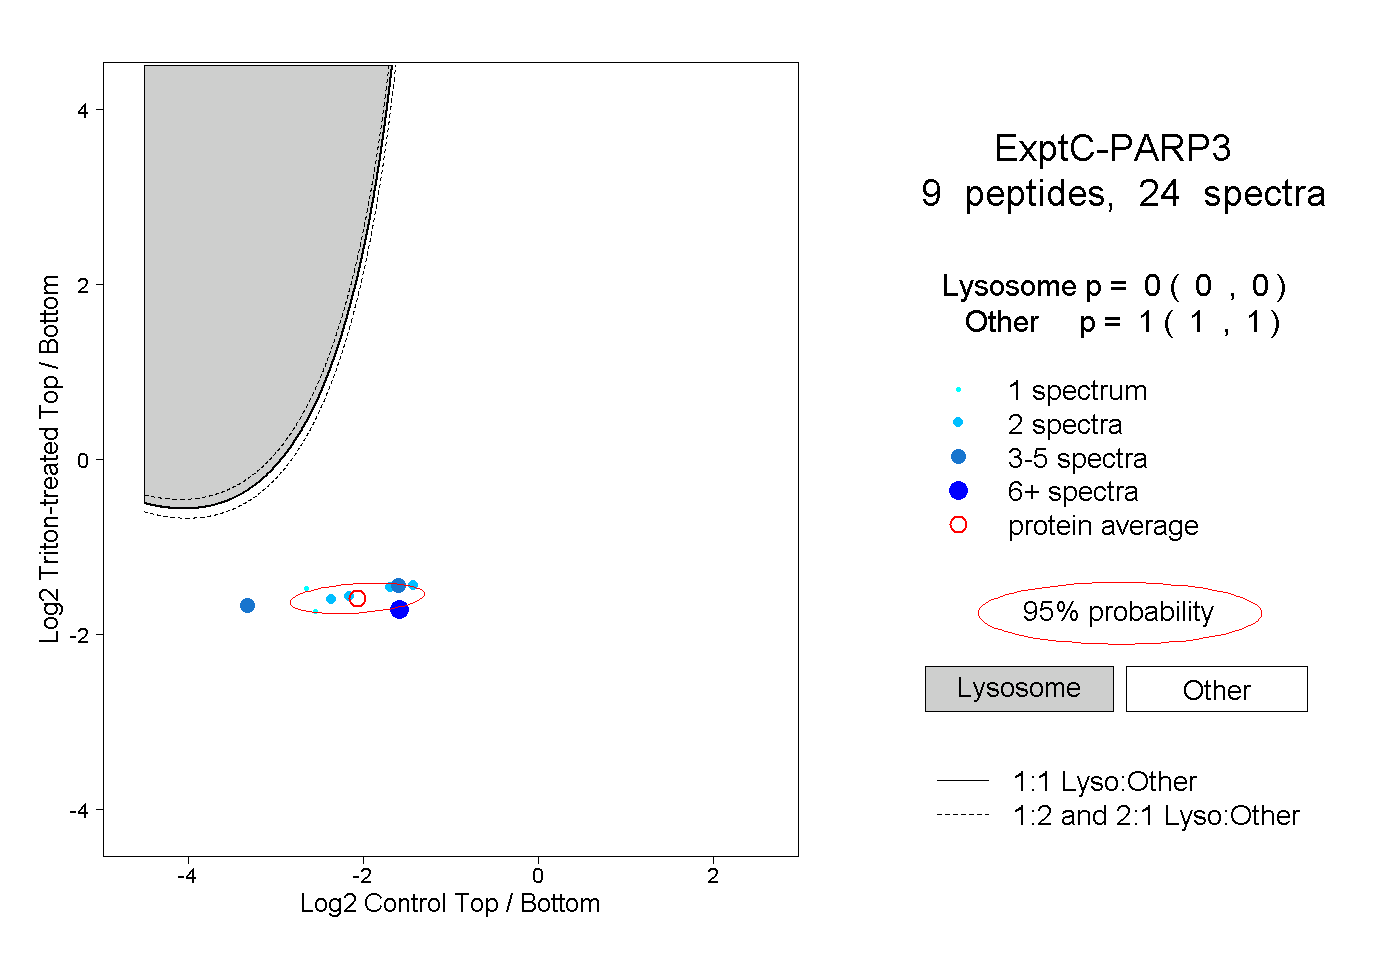
0.000 | 0.000
1.000 | 1.000