PARP3
[ENSRNOP00000017224]
Main page
| | | Plot |
Mito |
Lyso |
|
Perox |
ER |
Golgi |
PM |
Cytosol |
Nucleus |
|
| Expt A |
 17
17
peptides |
43
spectra |
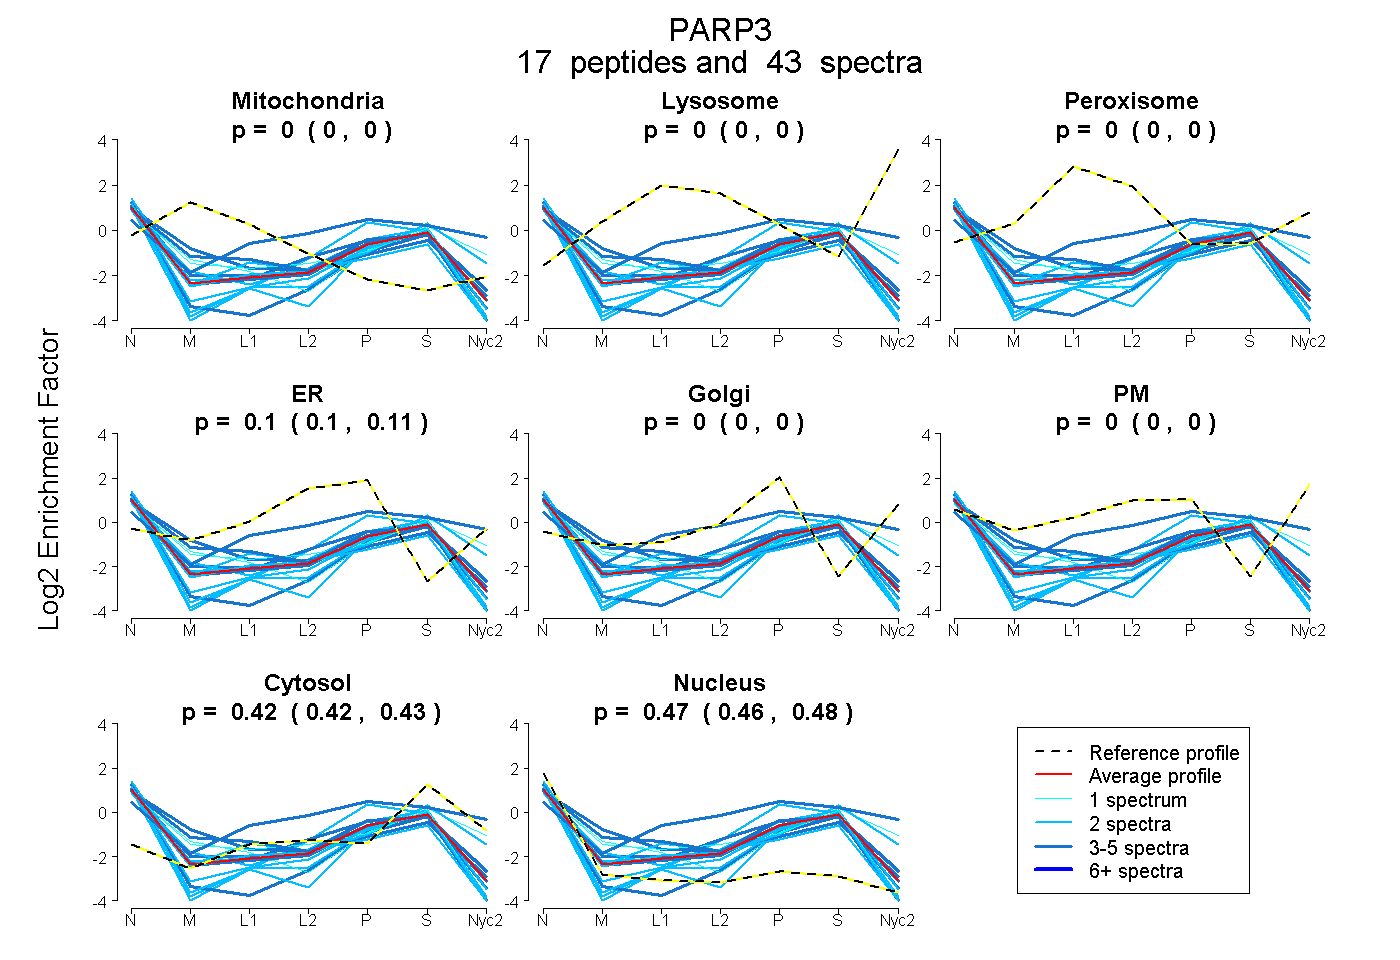 |
0.000
0.000 | 0.000 |
0.000
0.000 | 0.000 |
|
0.000
0.000 | 0.000 |
0.105
0.098 | 0.110 |
0.000
0.000 | 0.000 |
0.000
0.000 | 0.000 |
0.424
0.419 | 0.429 |
0.471
0.464 | 0.477 |
|
| | | Plot |
Mito |
|
Lyso or Perox |
|
ER |
Golgi |
PM |
Cytosol |
Nucleus |
|
| Expt B |
4
peptides |
8
spectra |
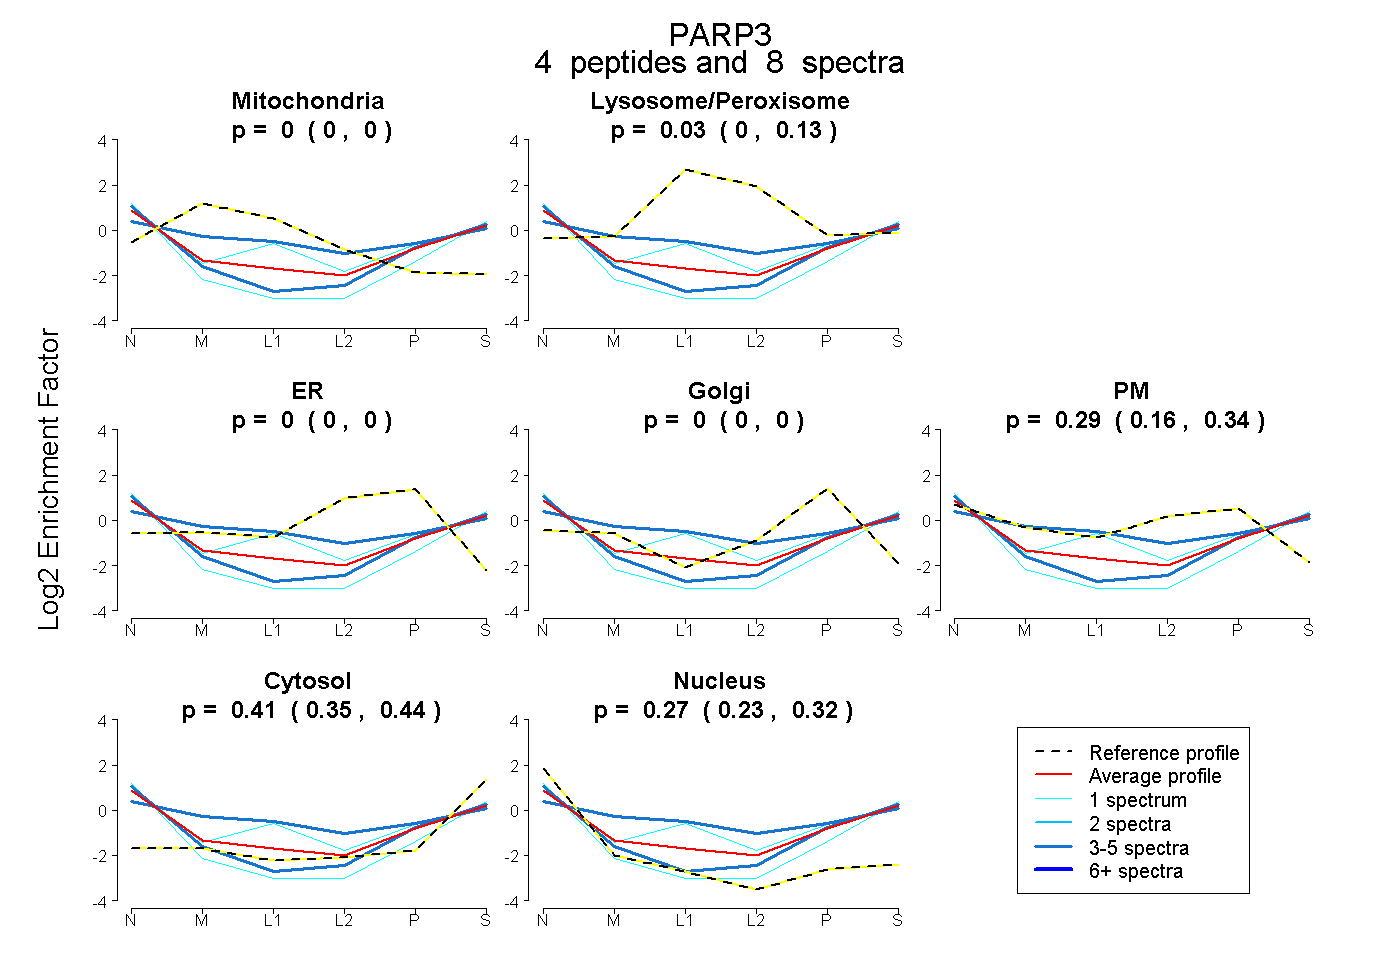 |
0.000
0.000 | 0.000 |
|
0.027
0.000 | 0.127 |
|
0.000
0.000 | 0.000 |
0.000
0.000 | 0.000 |
0.293
0.162 | 0.337 |
0.411
0.354 | 0.439 |
0.269
0.226 | 0.325 |
|
| 1 spectrum, FYIIQLLEEGGR |
0.000 |
|
0.000 |
|
0.000 |
0.004 |
0.000 |
0.481 |
0.514 |
|
| 3 spectra, SPPPGFDSVIAR |
0.000 |
|
0.000 |
|
0.000 |
0.162 |
0.052 |
0.411 |
0.375 |
|
| 3 spectra, RPDLQHVWK |
0.062 |
|
0.206 |
|
0.000 |
0.000 |
0.319 |
0.309 |
0.103 |
|
| 1 spectrum, QGTGEEGSFR |
0.000 |
|
0.277 |
|
0.000 |
0.000 |
0.104 |
0.270 |
0.349 |
|
| | | Plot |
|
Lyso |
|
|
|
|
|
|
|
Other |
| Expt C |
9
peptides |
24
spectra |
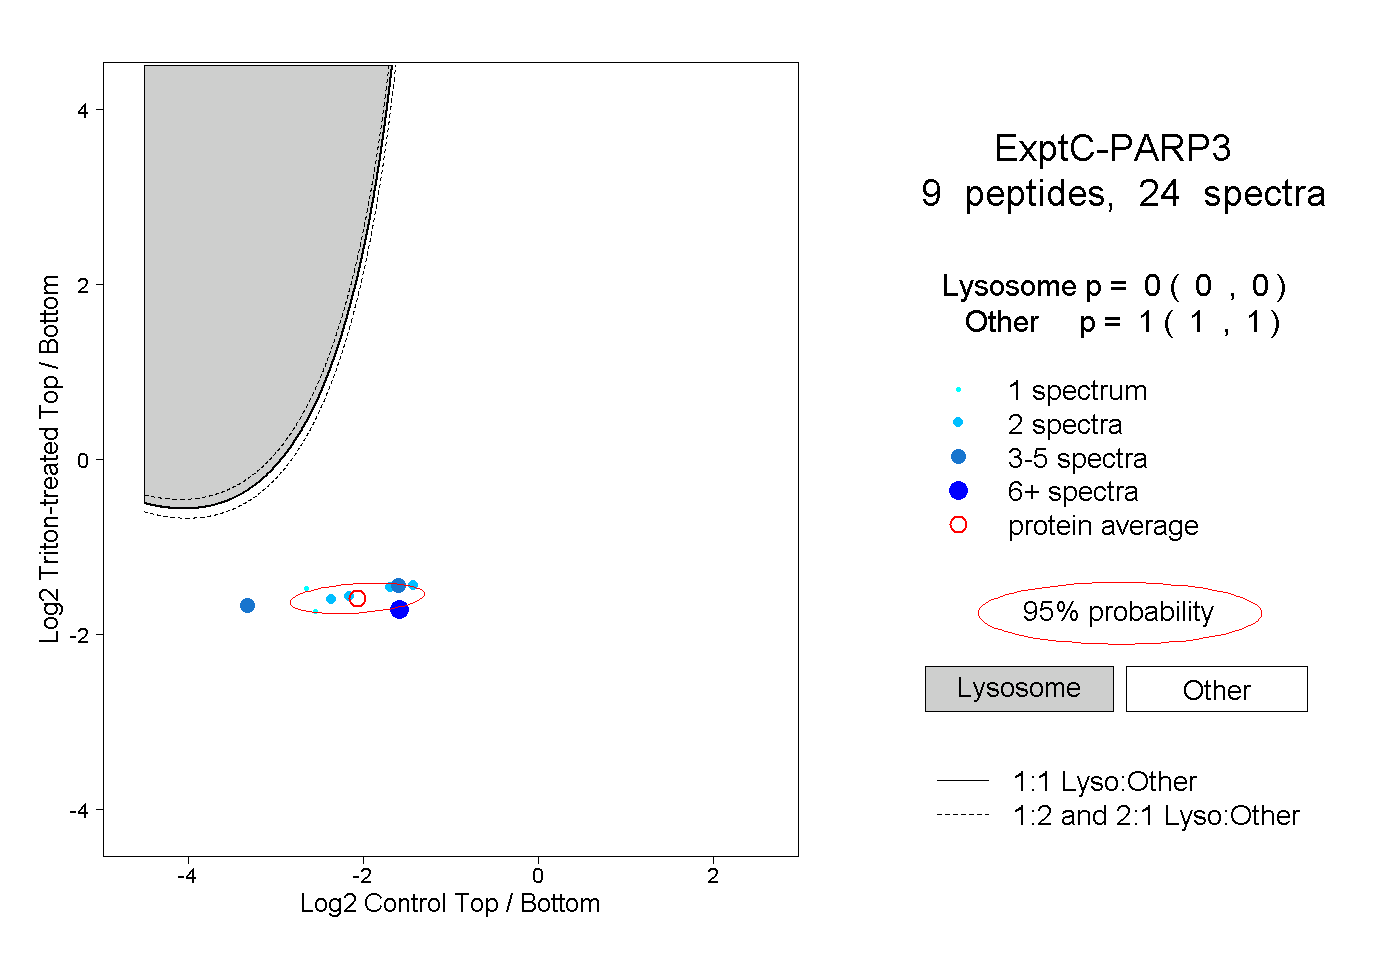 |
|
0.000
0.000 | 0.000 |
|
|
|
|
|
|
|
1.000
1.000 | 1.000 |