 3
3peptides
spectra
0.000 | 0.000
0.000 | 0.001
0.000 | 0.076
0.000 | 0.368
0.000 | 0.387
0.000 | 0.166
0.529 | 0.649
0.000 | 0.026
1peptide
spectra
NA | NA
NA | NA
| Plot | Mito | Lyso | Perox | ER | Golgi | PM | Cytosol | Nucleus | |||||
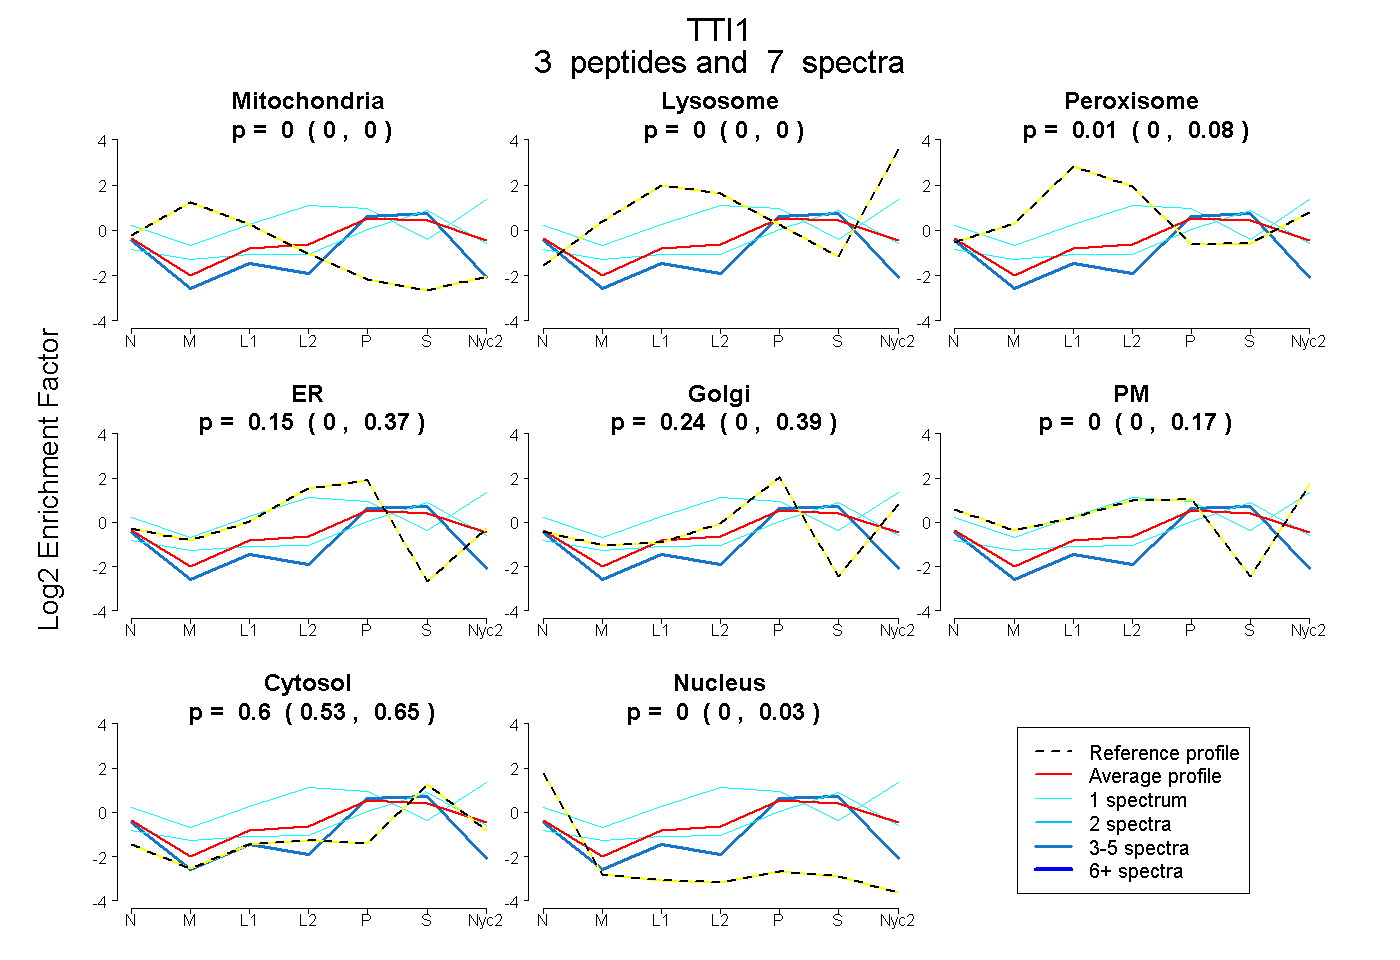
| Expt A |
3 peptides |
7 spectra |
|
0.000 0.000 | 0.000 |
0.000 0.000 | 0.001 |
0.012 0.000 | 0.076 |
0.148 0.000 | 0.368 |
0.240 0.000 | 0.387 |
0.000 0.000 | 0.166 |
0.600 0.529 | 0.649 |
0.000 0.000 | 0.026 |
||
| Plot | Lyso | Other | |||||||||||
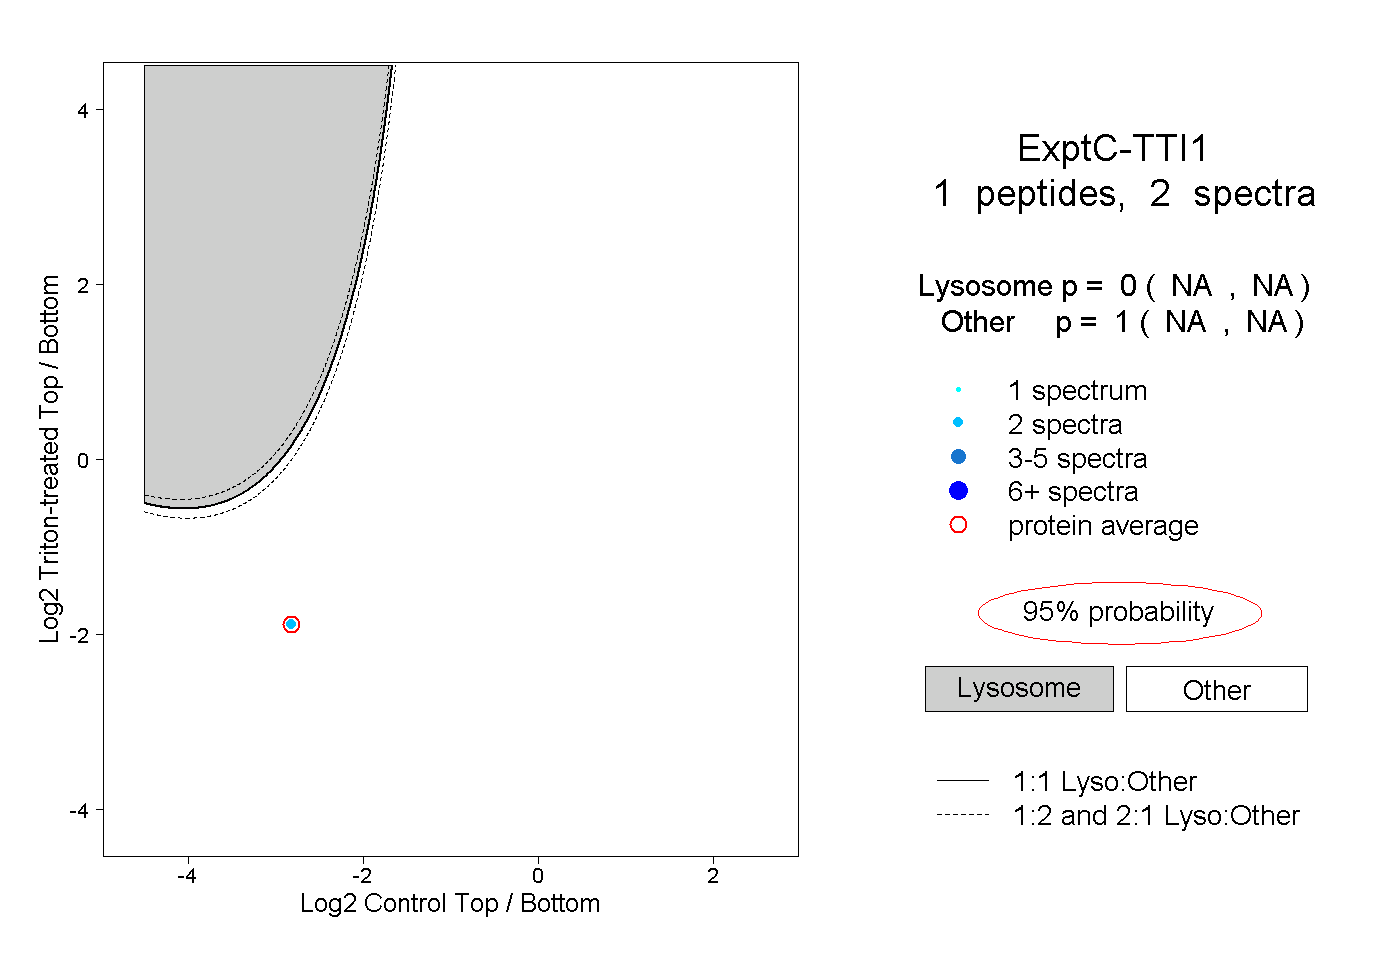
| Expt C |
1 peptide |
2 spectra |
|
0.000 NA | NA |
1.000 NA | NA |