 14
14peptides
spectra
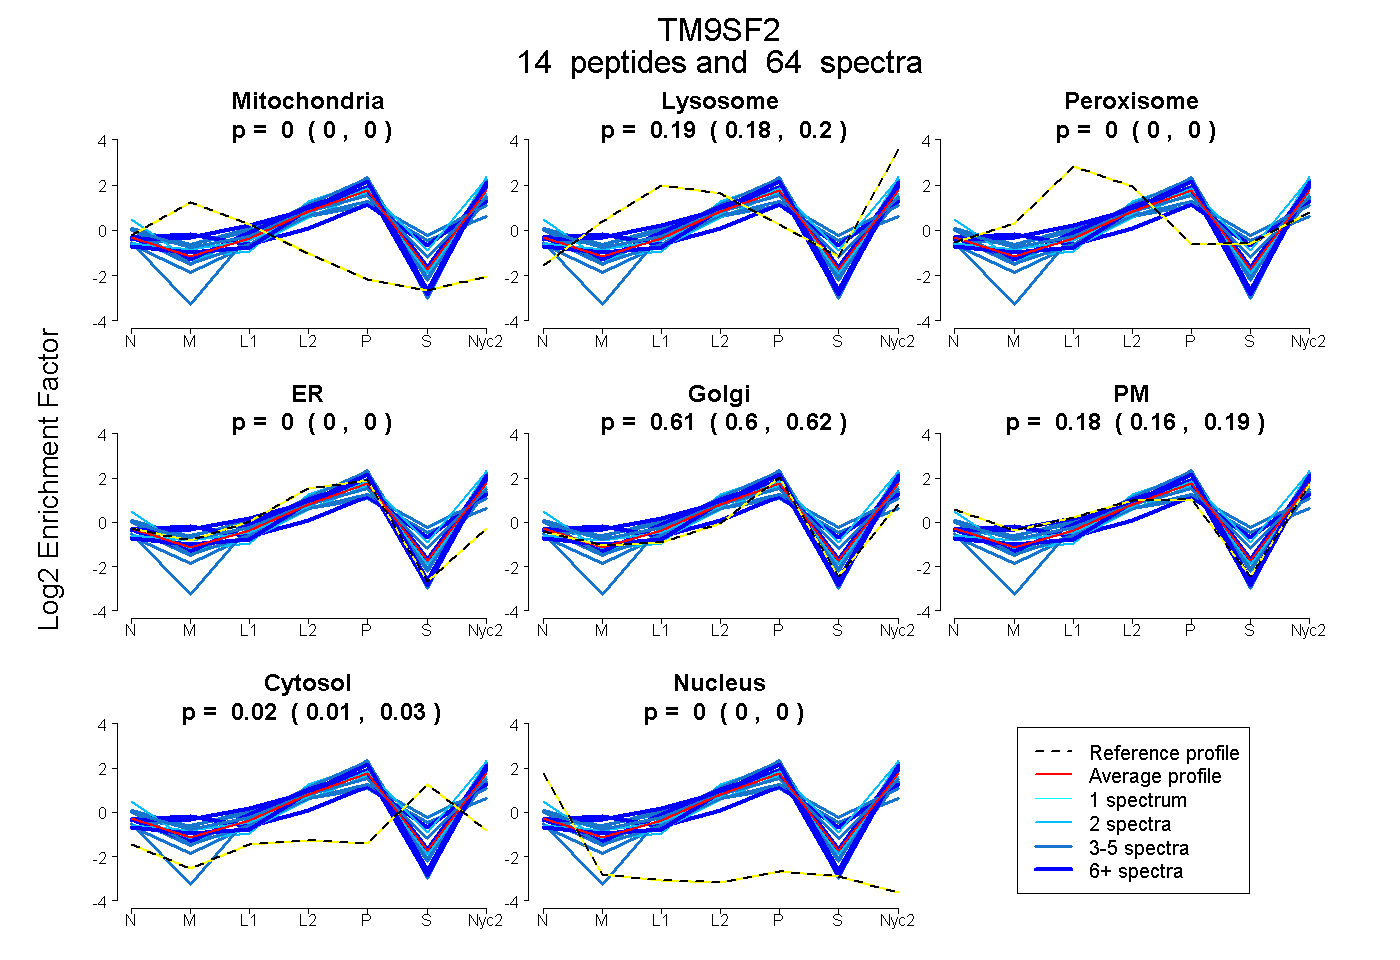
0.000 | 0.000
0.182 | 0.197
0.000 | 0.000
0.000 | 0.000
0.596 | 0.622
0.163 | 0.191
0.014 | 0.028
0.000 | 0.000
6peptides
spectra
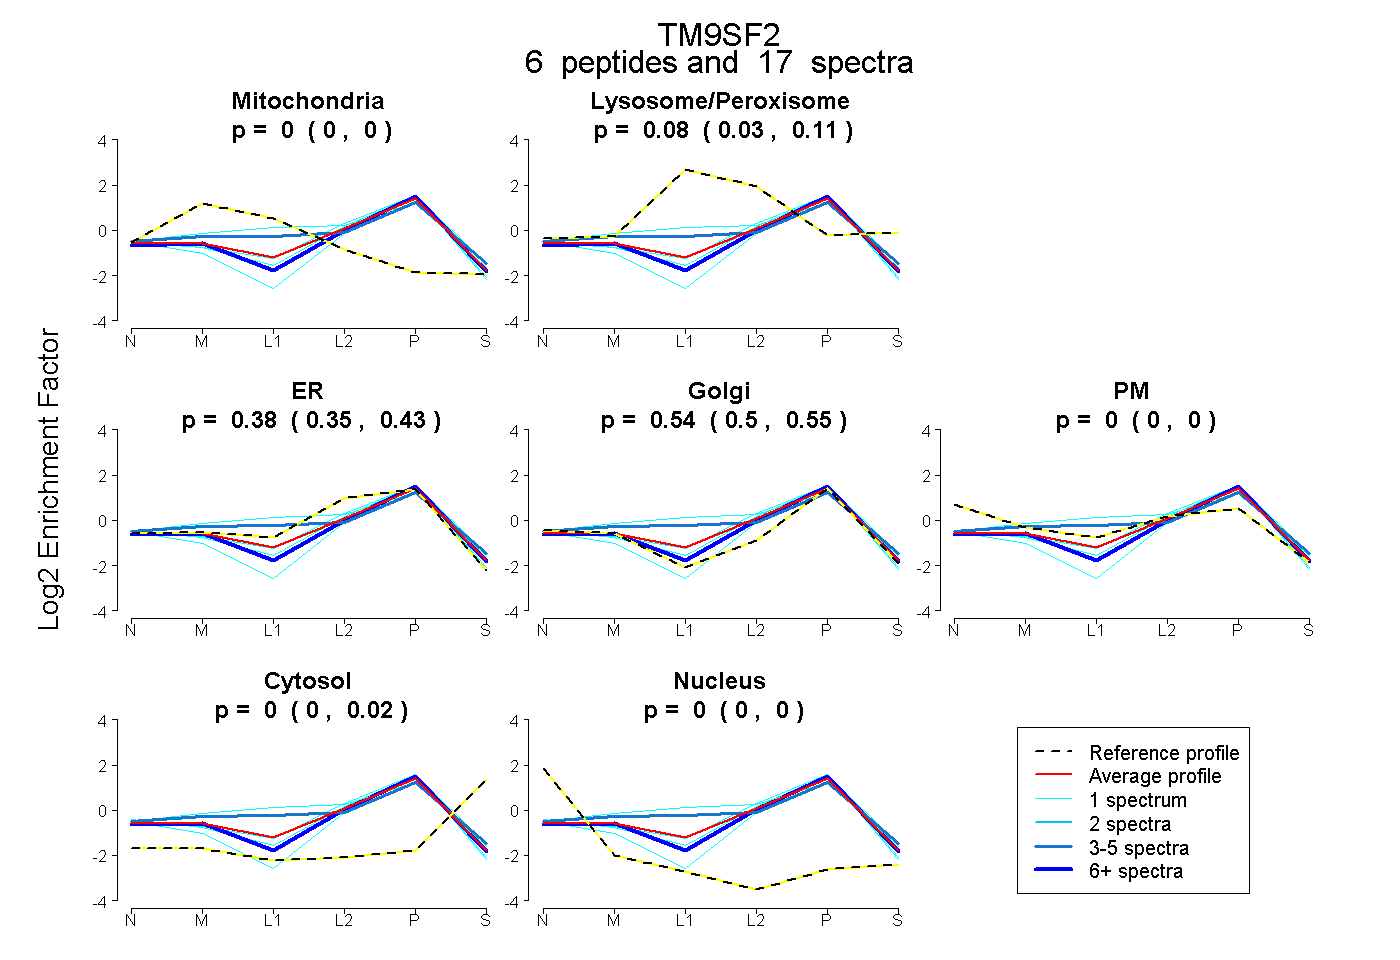
0.000 | 0.000
0.032 | 0.107
0.347 | 0.435
0.498 | 0.554
0.000 | 0.000
0.000 | 0.016
0.000 | 0.000
16peptides
spectra
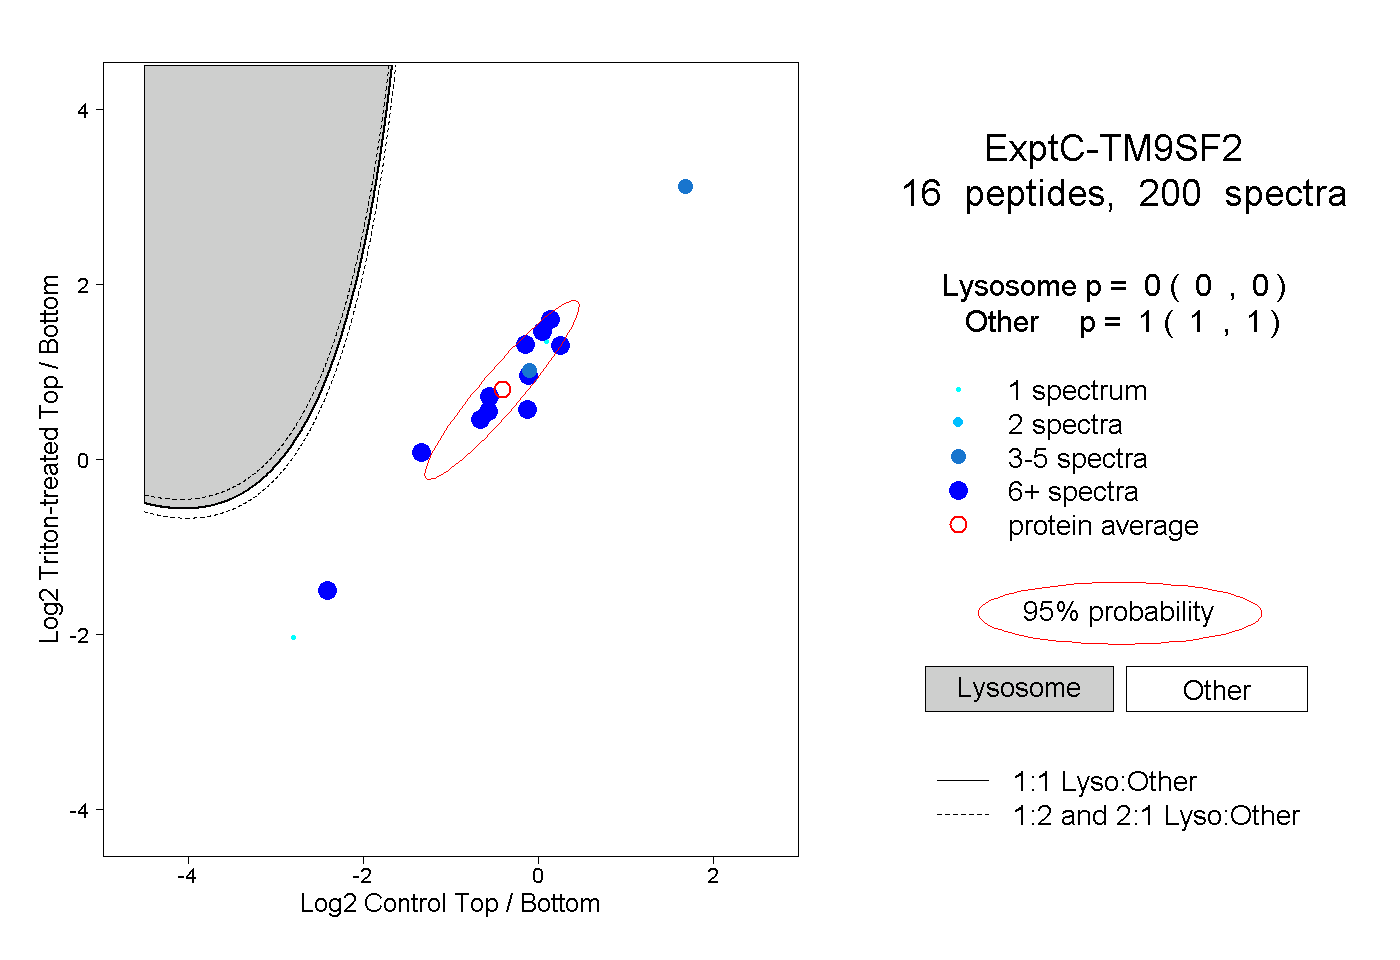
0.000 | 0.000
1.000 | 1.000
2peptides
spectra
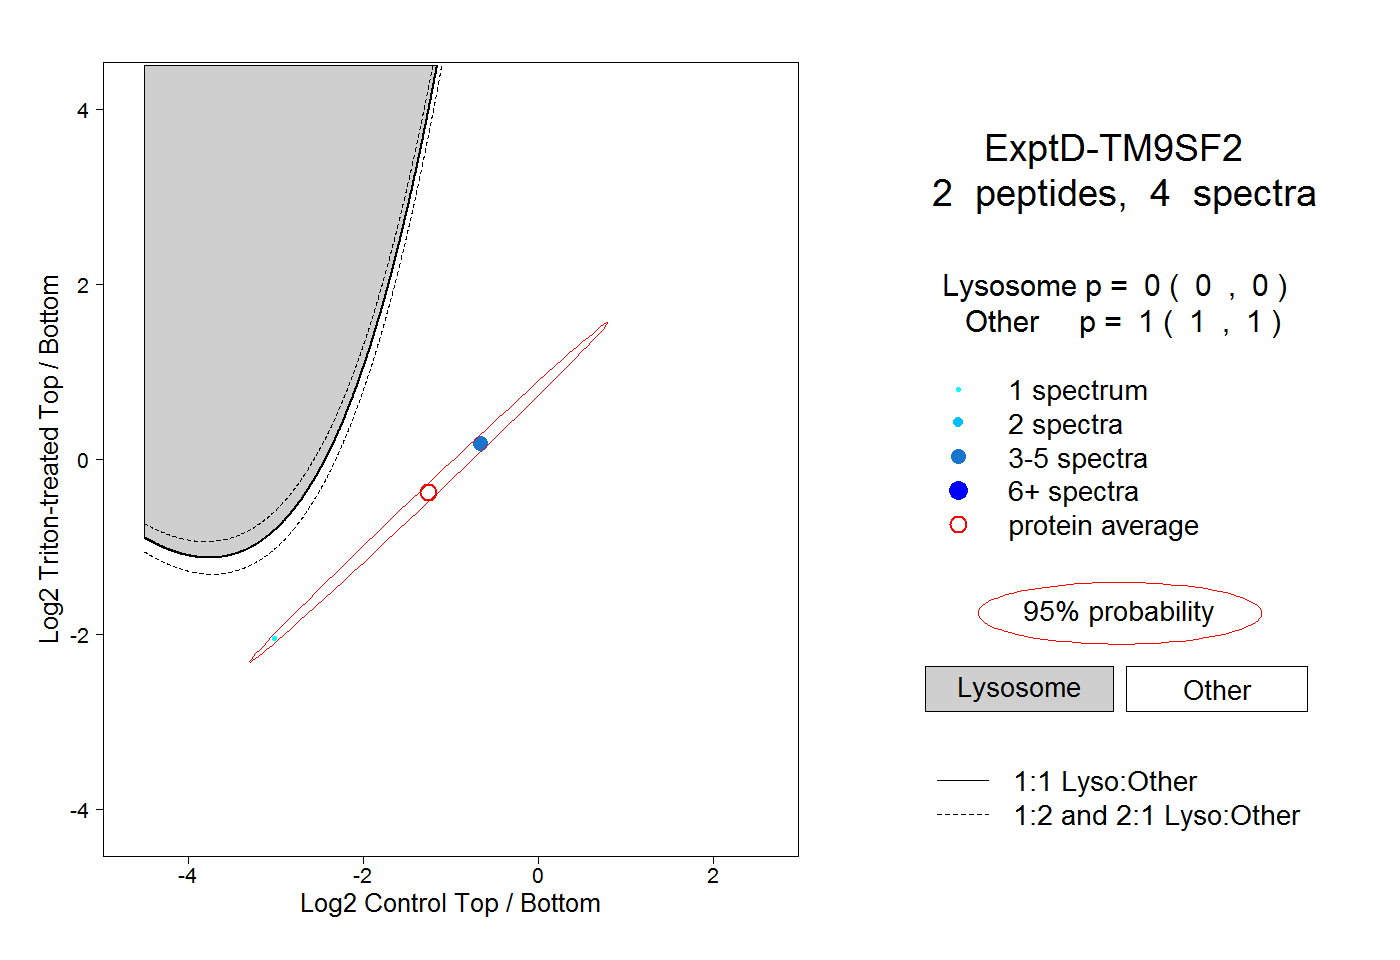
0.000 | 0.000
1.000 | 1.000