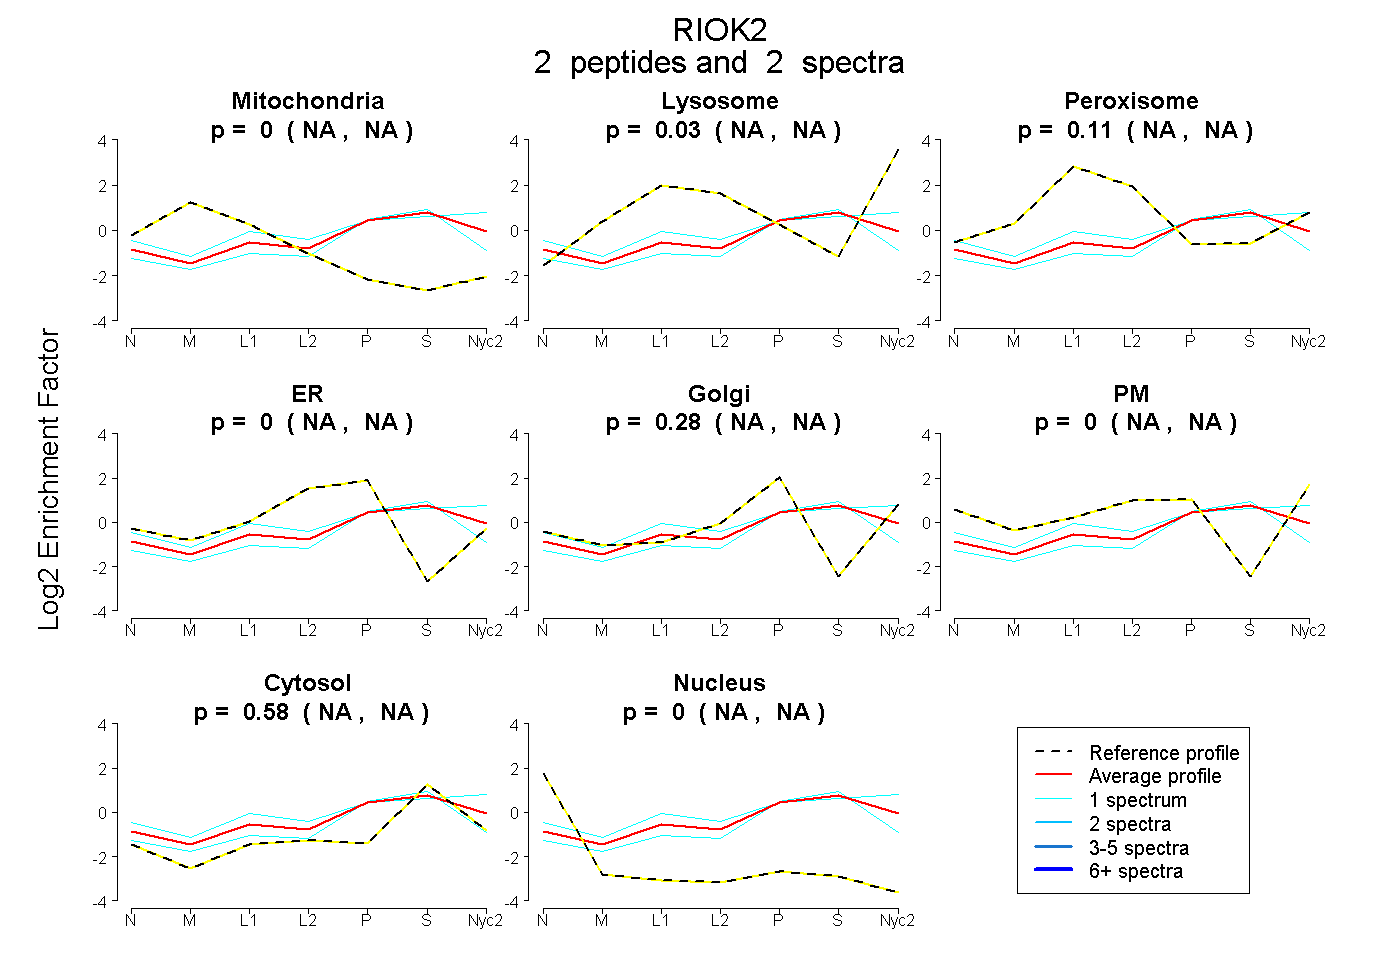
 2
2peptides
spectra
NA | NA
NA | NA
NA | NA
NA | NA
NA | NA
NA | NA
NA | NA
NA | NA
| Plot | Mito | Lyso | Perox | ER | Golgi | PM | Cytosol | Nucleus | |||||
| Expt A |
2 peptides |
2 spectra |
|
0.000 NA | NA |
0.027 NA | NA |
0.111 NA | NA |
0.000 NA | NA |
0.279 NA | NA |
0.000 NA | NA |
0.583 NA | NA |
0.000 NA | NA |
| 1 spectrum, LIAWER | 0.000 | 0.182 | 0.074 | 0.000 | 0.140 | 0.117 | 0.488 | 0.000 | ||
| 1 spectrum, EMQADDELLHPVGPDDK | 0.000 | 0.000 | 0.000 | 0.055 | 0.219 | 0.000 | 0.725 | 0.000 |
| Plot | Lyso | Other | |||||||||||
| Expt C |
1 peptide |
1 spectrum |
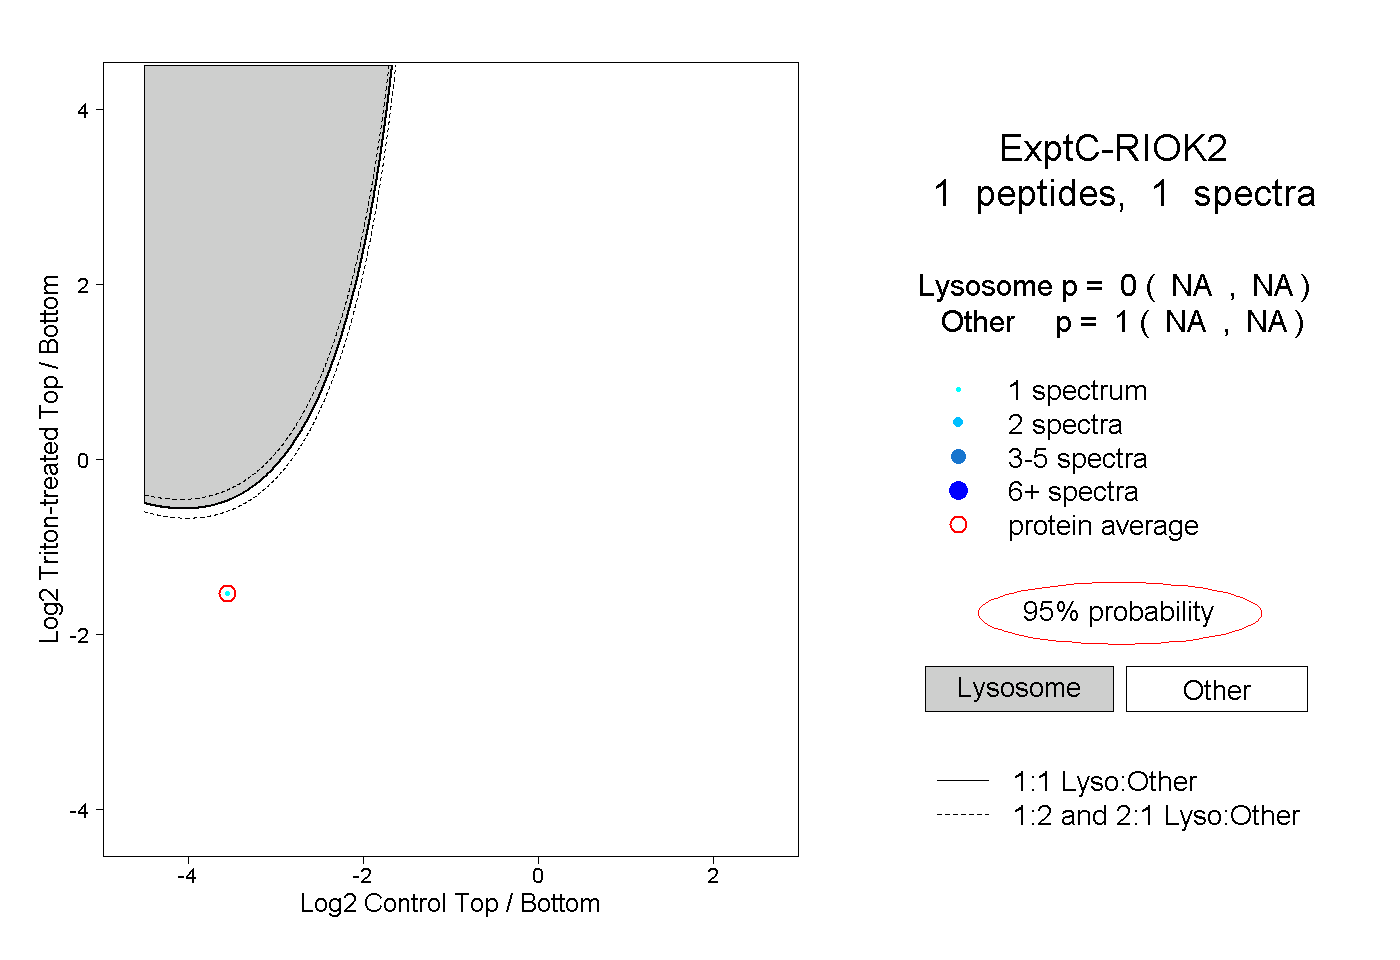 |
0.000 NA | NA |
1.000 NA | NA |