 7
7peptides
spectra
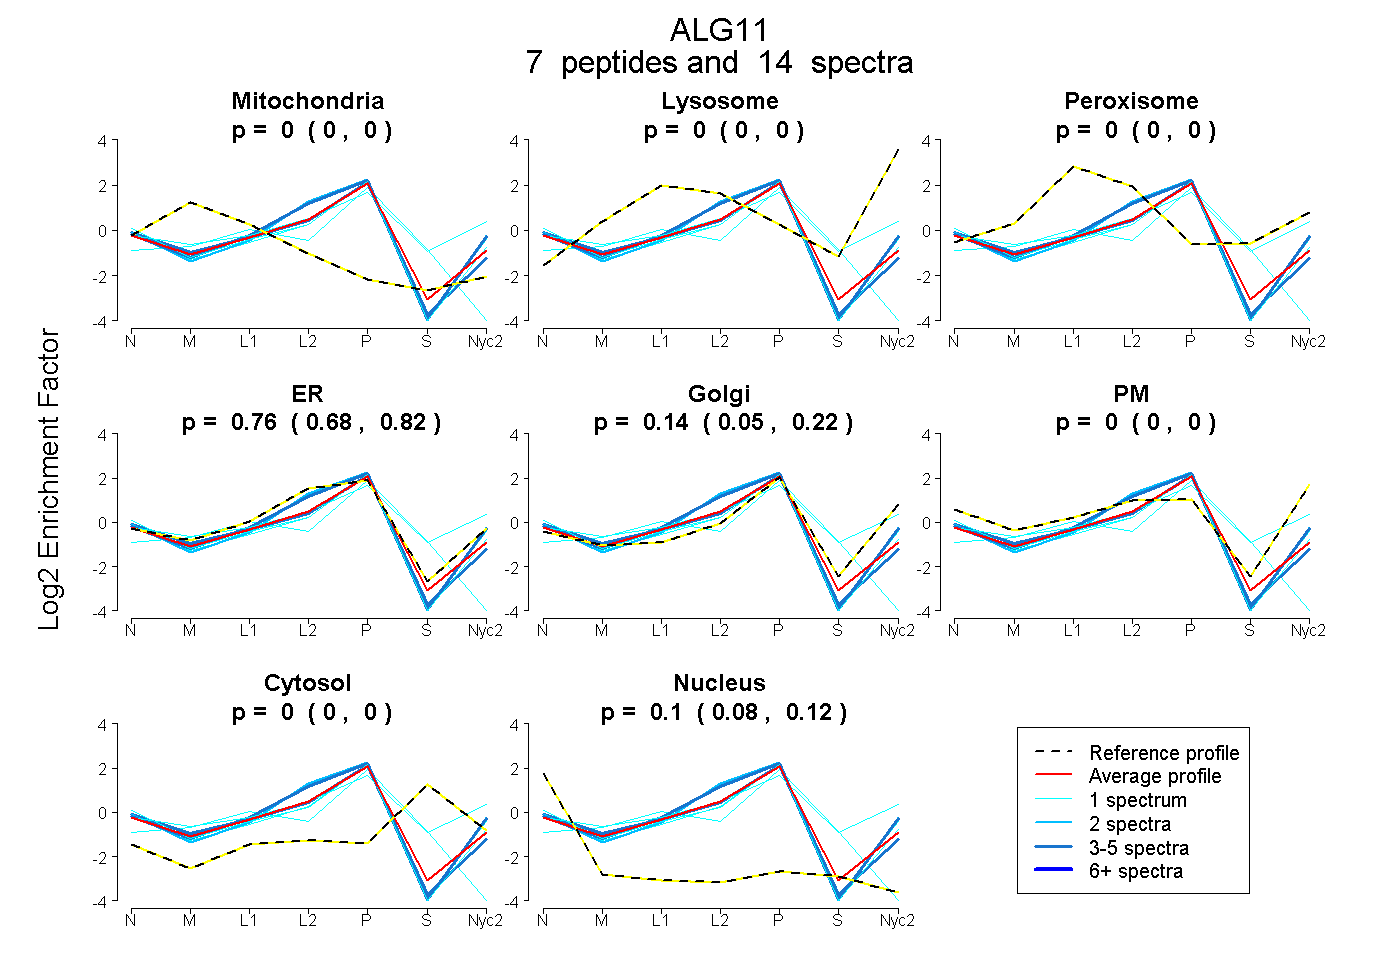
0.000 | 0.000
0.000 | 0.000
0.000 | 0.000
0.683 | 0.821
0.047 | 0.217
0.000 | 0.000
0.000 | 0.000
0.081 | 0.118
| Plot | Mito | Lyso | Perox | ER | Golgi | PM | Cytosol | Nucleus | |||||
| Expt A |
7 peptides |
14 spectra |
|
0.000 0.000 | 0.000 |
0.000 0.000 | 0.000 |
0.000 0.000 | 0.000 |
0.756 0.683 | 0.821 |
0.143 0.047 | 0.217 |
0.000 0.000 | 0.000 |
0.000 0.000 | 0.000 |
0.101 0.081 | 0.118 |
| 3 spectra, VLWCALR | 0.000 | 0.000 | 0.000 | 0.870 | 0.105 | 0.000 | 0.000 | 0.025 | ||
| 1 spectrum, INISFDELK | 0.000 | 0.000 | 0.000 | 0.543 | 0.366 | 0.000 | 0.000 | 0.091 | ||
| 1 spectrum, YVGGCR | 0.000 | 0.000 | 0.188 | 0.147 | 0.539 | 0.000 | 0.126 | 0.000 | ||
| 5 spectra, LFLIGGCR | 0.000 | 0.000 | 0.000 | 0.852 | 0.017 | 0.000 | 0.000 | 0.131 | ||
| 1 spectrum, FSDQEFEVAFLCSMGK | 0.150 | 0.000 | 0.000 | 0.528 | 0.000 | 0.000 | 0.218 | 0.104 | ||
| 2 spectra, NQNPGFNNAAFISR | 0.000 | 0.000 | 0.000 | 0.849 | 0.119 | 0.000 | 0.000 | 0.031 | ||
| 1 spectrum, VTPGHLLVSIGQFRPEK | 0.000 | 0.000 | 0.000 | 0.671 | 0.210 | 0.000 | 0.000 | 0.119 |
| Plot | Mito | Lyso or Perox | ER | Golgi | PM | Cytosol | Nucleus | ||||||
| Expt B |
5 peptides |
11 spectra |
 |
0.000 0.000 | 0.000 |
0.000 0.000 | 0.000 |
0.682 0.647 | 0.712 |
0.318 0.279 | 0.348 |
0.000 0.000 | 0.000 |
0.000 0.000 | 0.000 |
0.000 0.000 | 0.000 |
|||
| Plot | Lyso | Other | |||||||||||
| Expt C |
7 peptides |
14 spectra |
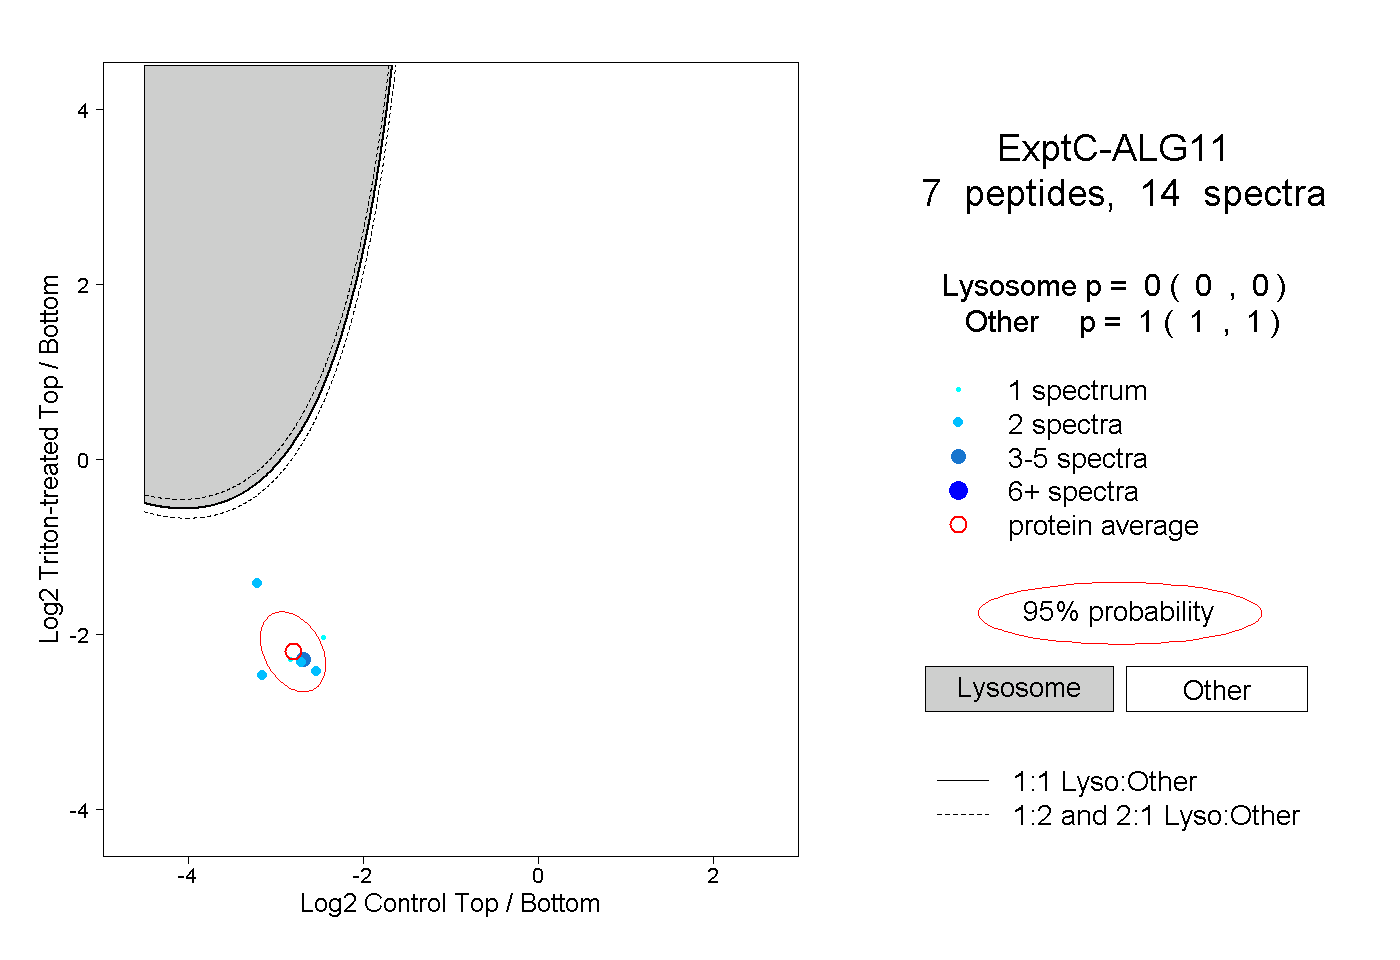 |
0.000 0.000 | 0.000 |
1.000 1.000 | 1.000 |
||||||||
| Plot | Lyso | Other | |||||||||||
| Expt D |
2 peptides |
3 spectra |
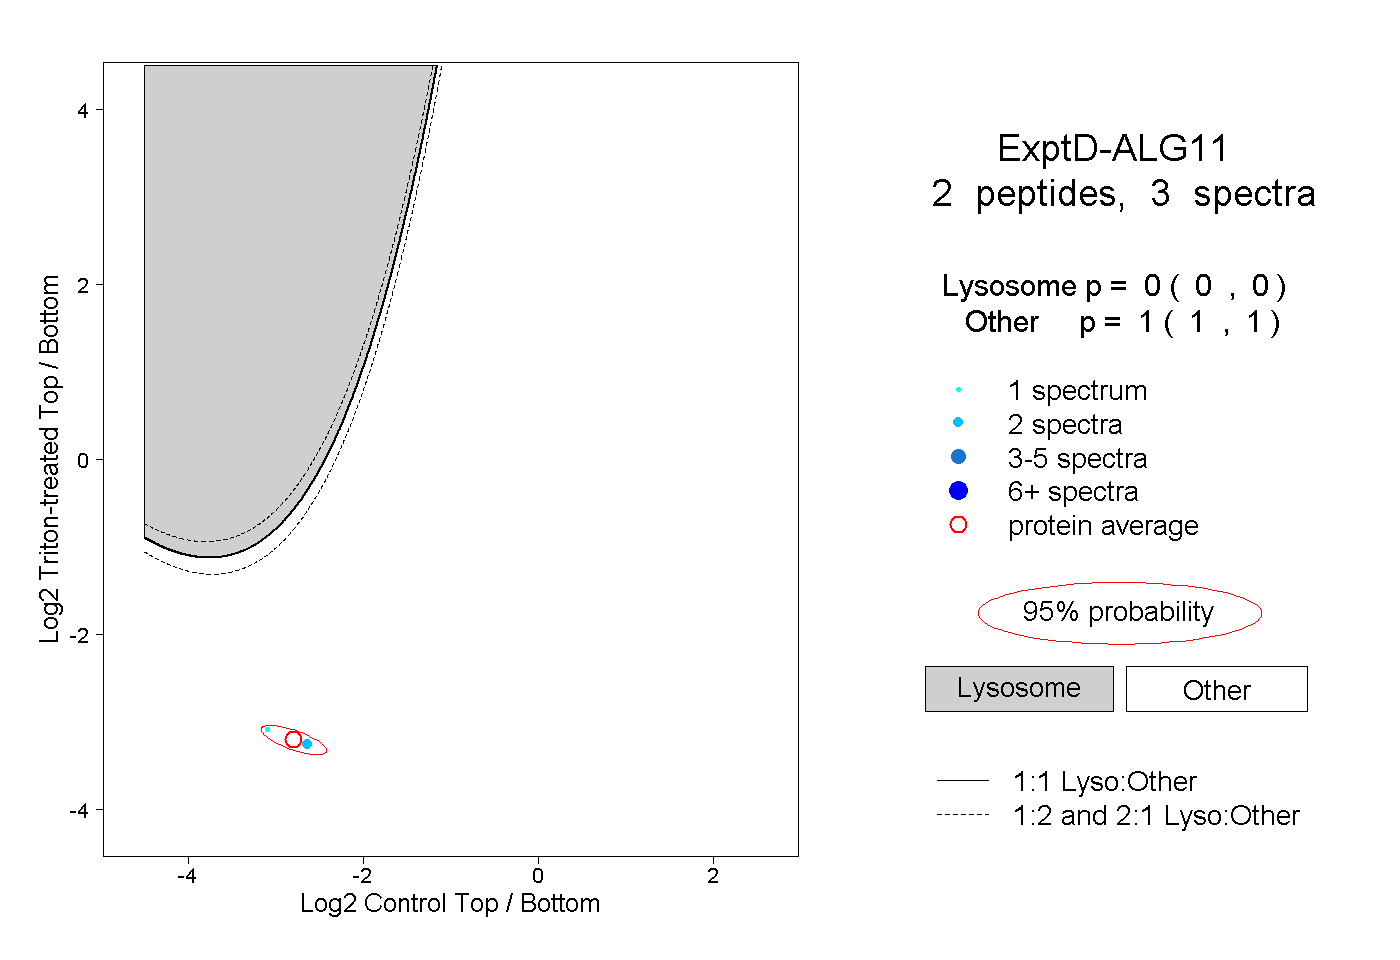 |
0.000 0.000 | 0.000 |
1.000 1.000 | 1.000 |