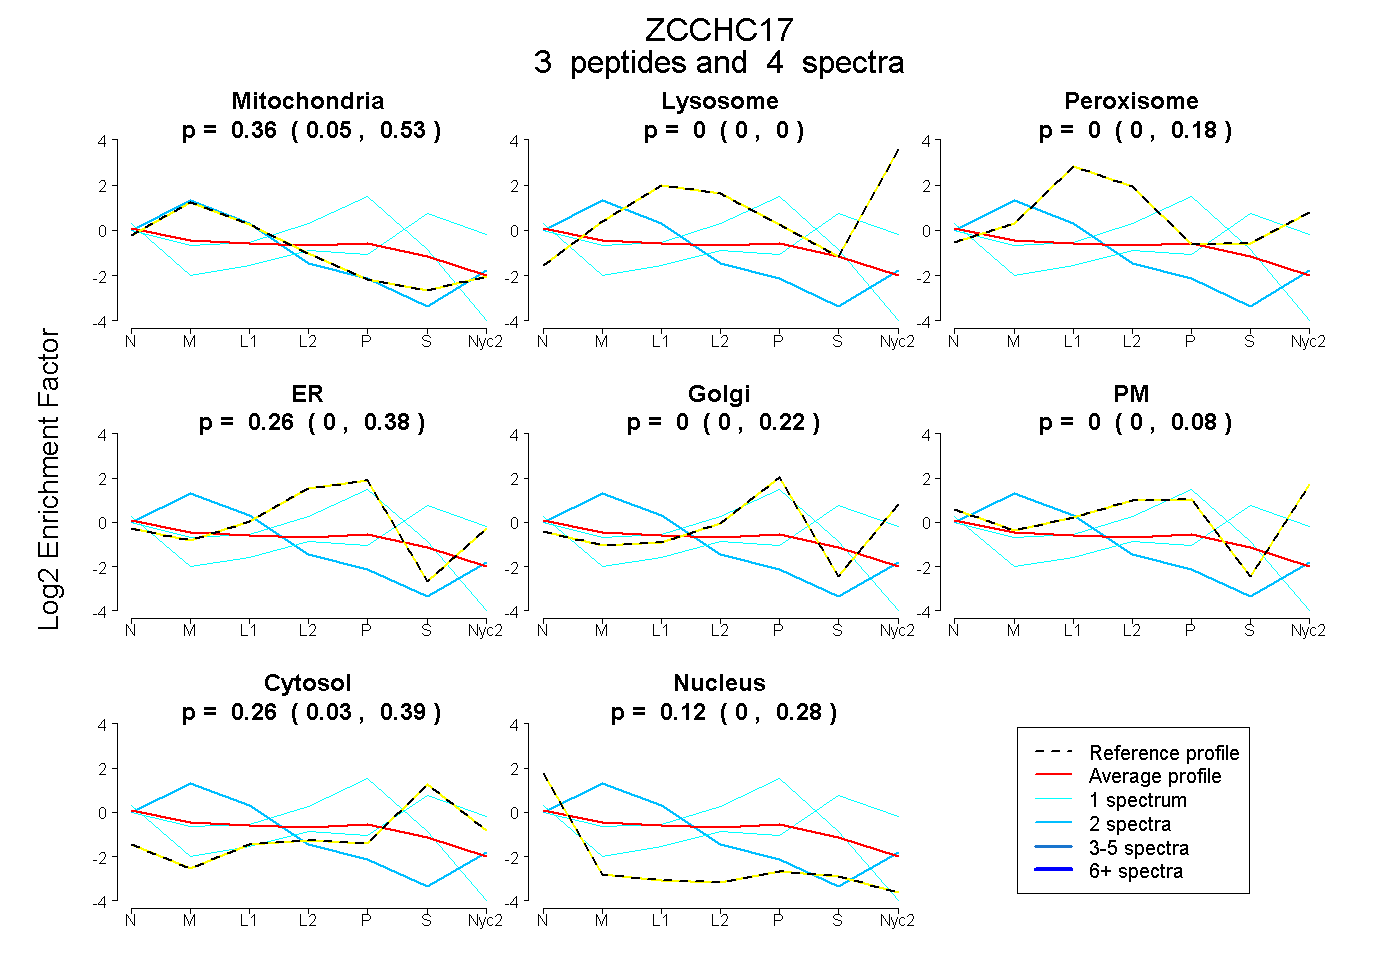
 3
3peptides
spectra
0.050 | 0.534
0.000 | 0.000
0.000 | 0.180
0.000 | 0.382
0.000 | 0.216
0.000 | 0.081
0.028 | 0.391
0.000 | 0.284
| Plot | Mito | Lyso | Perox | ER | Golgi | PM | Cytosol | Nucleus | |||||
| Expt A |
3 peptides |
4 spectra |
|
0.359 0.050 | 0.534 |
0.000 0.000 | 0.000 |
0.000 0.000 | 0.180 |
0.261 0.000 | 0.382 |
0.000 0.000 | 0.216 |
0.000 0.000 | 0.081 |
0.258 0.028 | 0.391 |
0.122 0.000 | 0.284 |
| 1 spectrum, QGIVHR | 0.000 | 0.000 | 0.000 | 0.000 | 0.000 | 0.218 | 0.696 | 0.086 | ||
| 1 spectrum, DLDPNNVIIEQEER | 0.094 | 0.000 | 0.000 | 0.570 | 0.000 | 0.000 | 0.141 | 0.195 | ||
| 2 spectra, IPGCR | 0.972 | 0.000 | 0.000 | 0.000 | 0.000 | 0.006 | 0.000 | 0.022 |
| Plot | Lyso | Other | |||||||||||
| Expt C |
1 peptide |
1 spectrum |
 |
0.000 NA | NA |
1.000 NA | NA |