7
7peptides
spectra
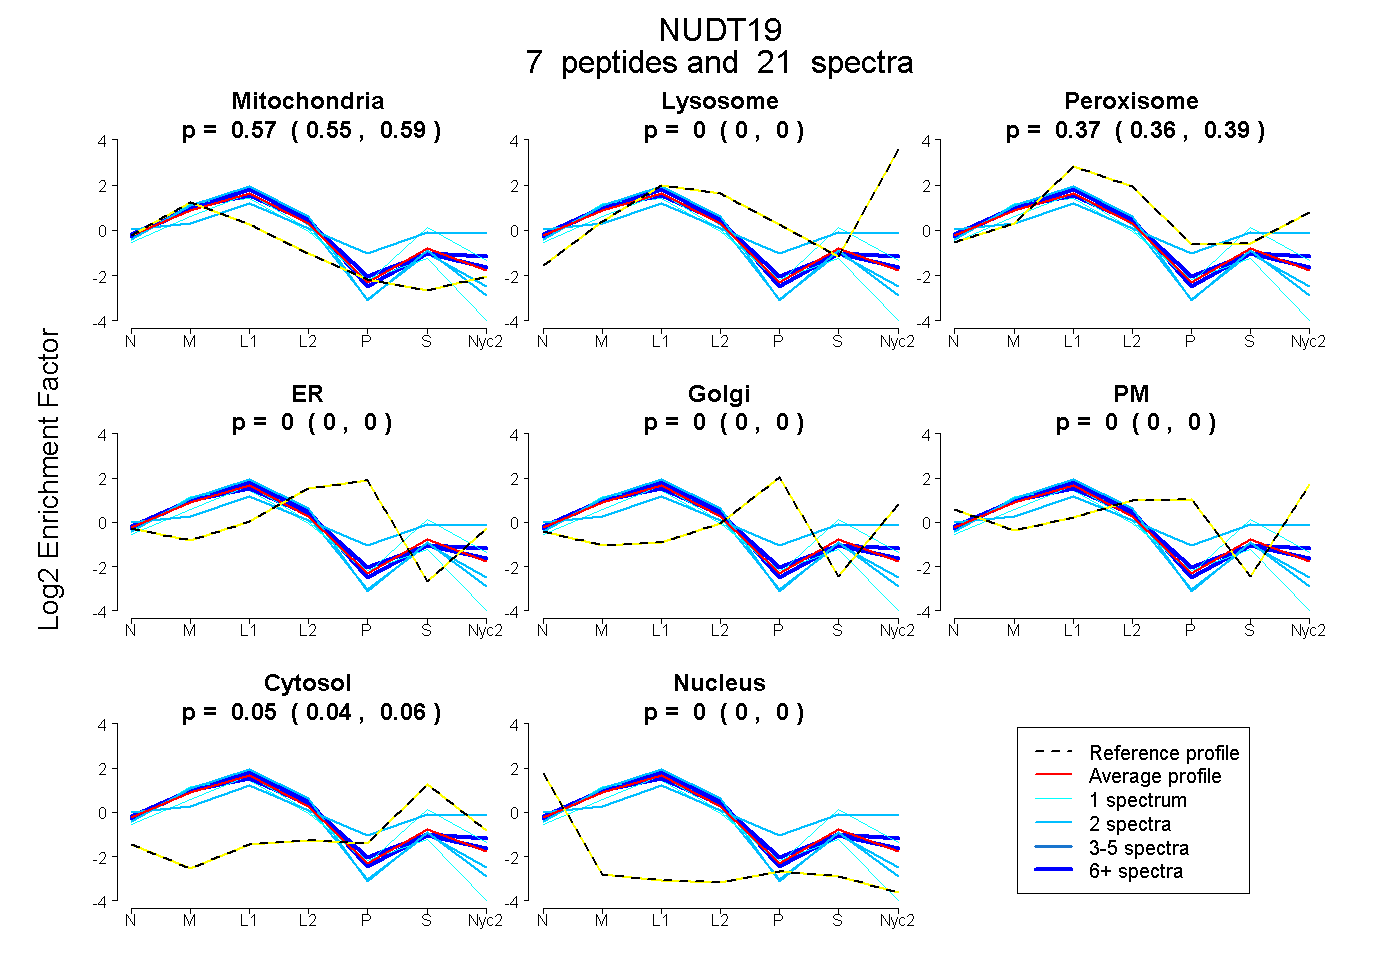
0.552 | 0.590
0.000 | 0.000
0.357 | 0.389
0.000 | 0.000
0.000 | 0.000
0.000 | 0.000
0.043 | 0.061
0.000 | 0.000
8peptides
spectra
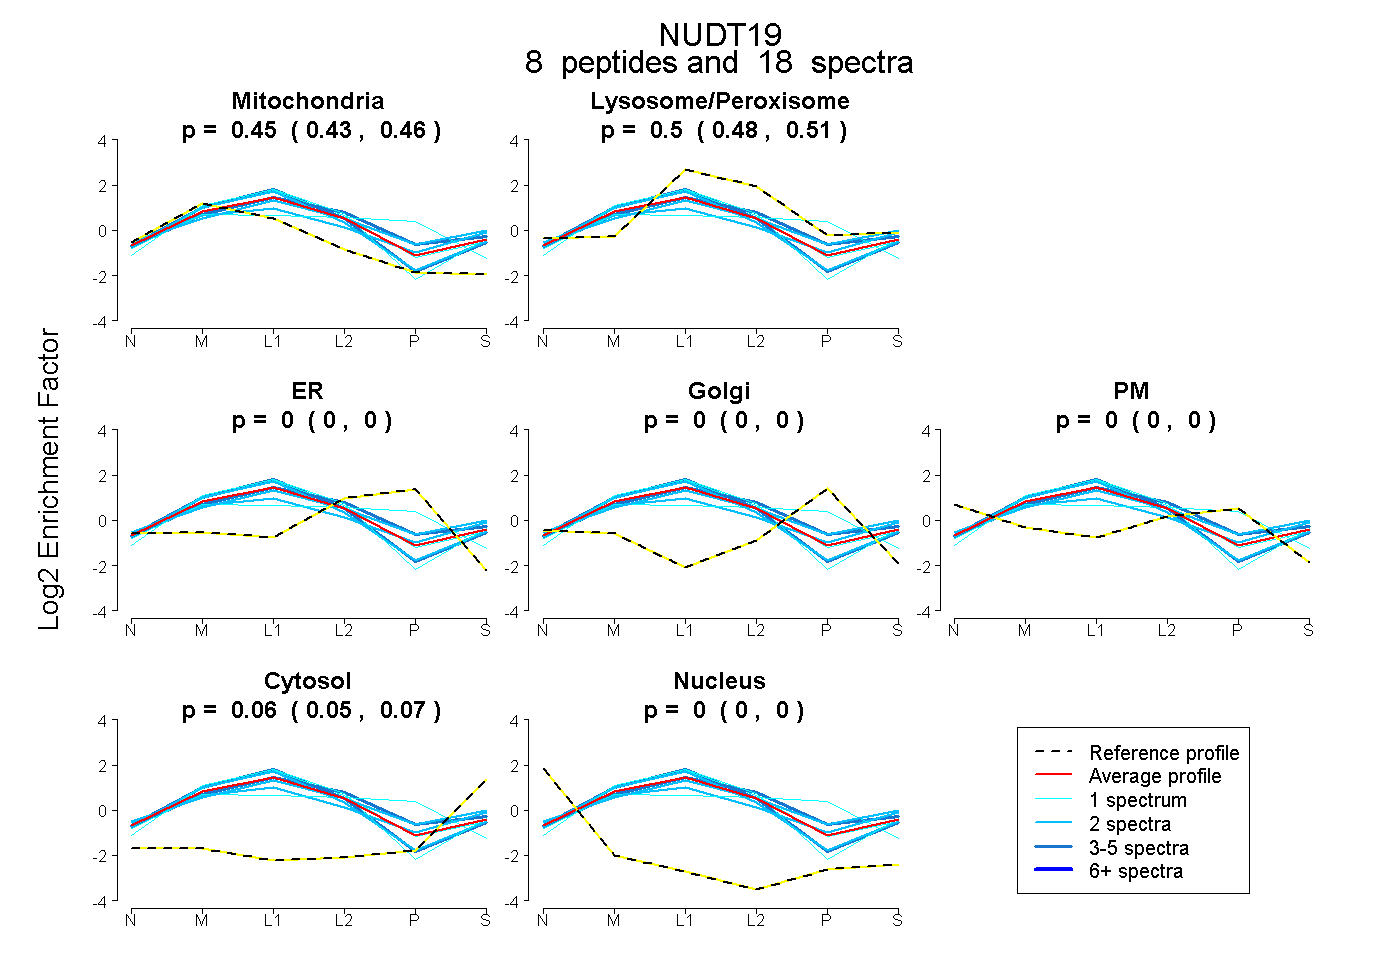
0.429 | 0.459
0.481 | 0.508
0.000 | 0.000
0.000 | 0.000
0.000 | 0.000
0.050 | 0.067
0.000 | 0.000