 7
7peptides
spectra
0.552 | 0.590
0.000 | 0.000
0.357 | 0.389
0.000 | 0.000
0.000 | 0.000
0.000 | 0.000
0.043 | 0.061
0.000 | 0.000
| Plot | Mito | Lyso | Perox | ER | Golgi | PM | Cytosol | Nucleus | |||||
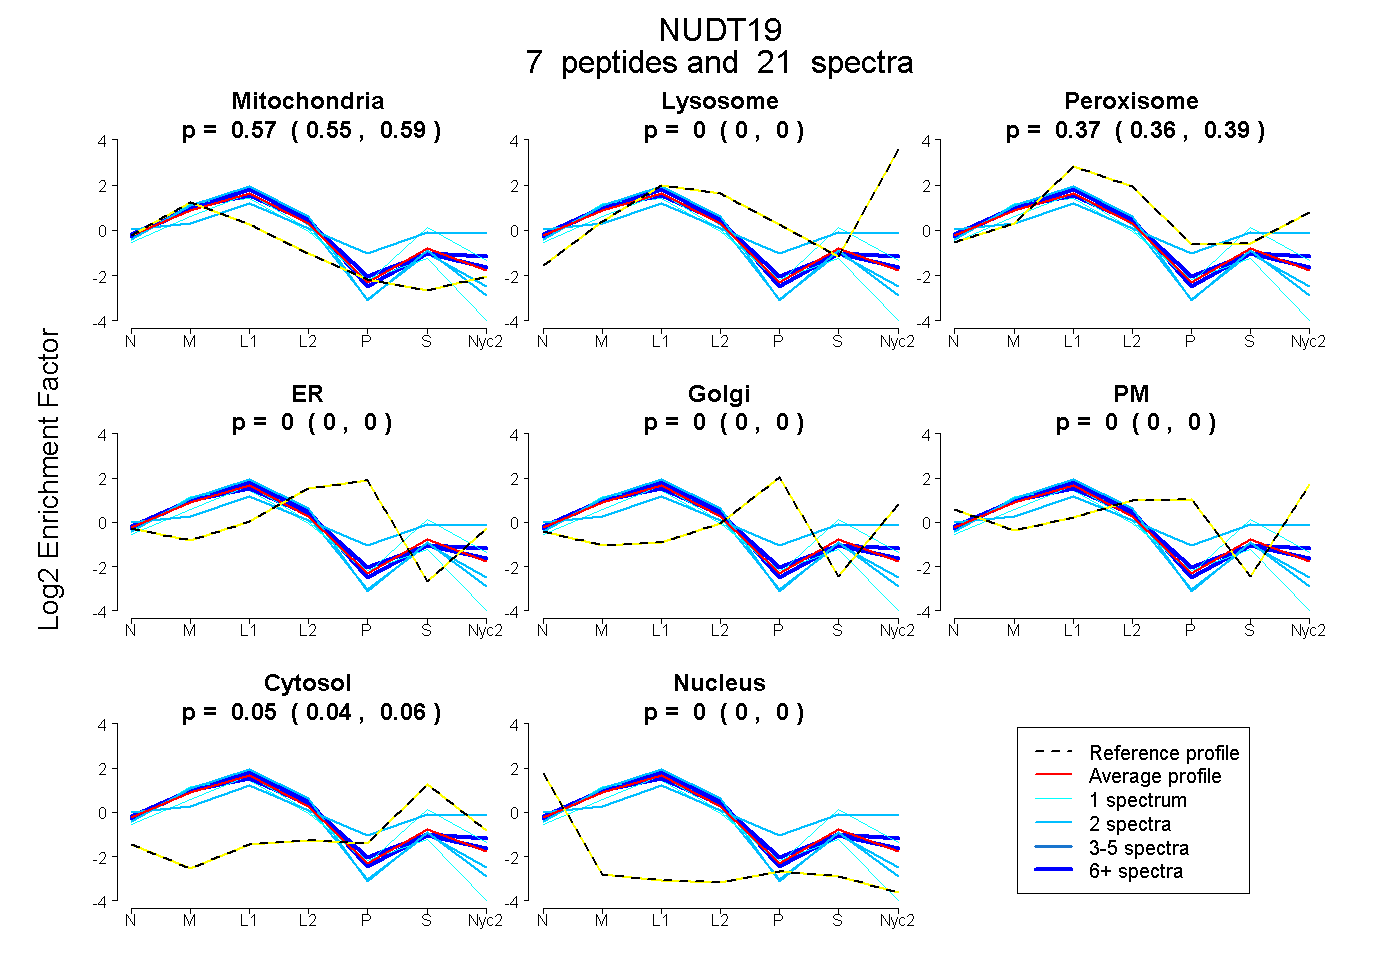
| Expt A |
7 peptides |
21 spectra |
|
0.573 0.552 | 0.590 |
0.000 0.000 | 0.000 |
0.374 0.357 | 0.389 |
0.000 0.000 | 0.000 |
0.000 0.000 | 0.000 |
0.000 0.000 | 0.000 |
0.053 0.043 | 0.061 |
0.000 0.000 | 0.000 |
| 7 spectra, LLIIQR | 0.544 | 0.000 | 0.433 | 0.000 | 0.000 | 0.000 | 0.023 | 0.000 | ||
| 1 spectrum, VEPDLAEVVGYK | 0.395 | 0.000 | 0.407 | 0.000 | 0.000 | 0.000 | 0.198 | 0.000 | ||
| 2 spectra, WLSPSEATECFLSK | 0.237 | 0.000 | 0.515 | 0.000 | 0.000 | 0.014 | 0.234 | 0.000 | ||
| 2 spectra, EIWLAPPQFYEVR | 0.711 | 0.000 | 0.289 | 0.000 | 0.000 | 0.000 | 0.000 | 0.000 | ||
| 6 spectra, ETFEEAGVLLLRPR | 0.589 | 0.000 | 0.411 | 0.000 | 0.000 | 0.000 | 0.000 | 0.000 | ||
| 1 spectrum, FCLDHPLEVPEK | 0.885 | 0.000 | 0.107 | 0.000 | 0.000 | 0.000 | 0.008 | 0.000 | ||
| 2 spectra, QPSFPGLFHGDADGAALPDDVALR | 0.708 | 0.000 | 0.292 | 0.000 | 0.000 | 0.000 | 0.000 | 0.000 |
| Plot | Mito | Lyso or Perox | ER | Golgi | PM | Cytosol | Nucleus | ||||||
| Expt B |
8 peptides |
18 spectra |
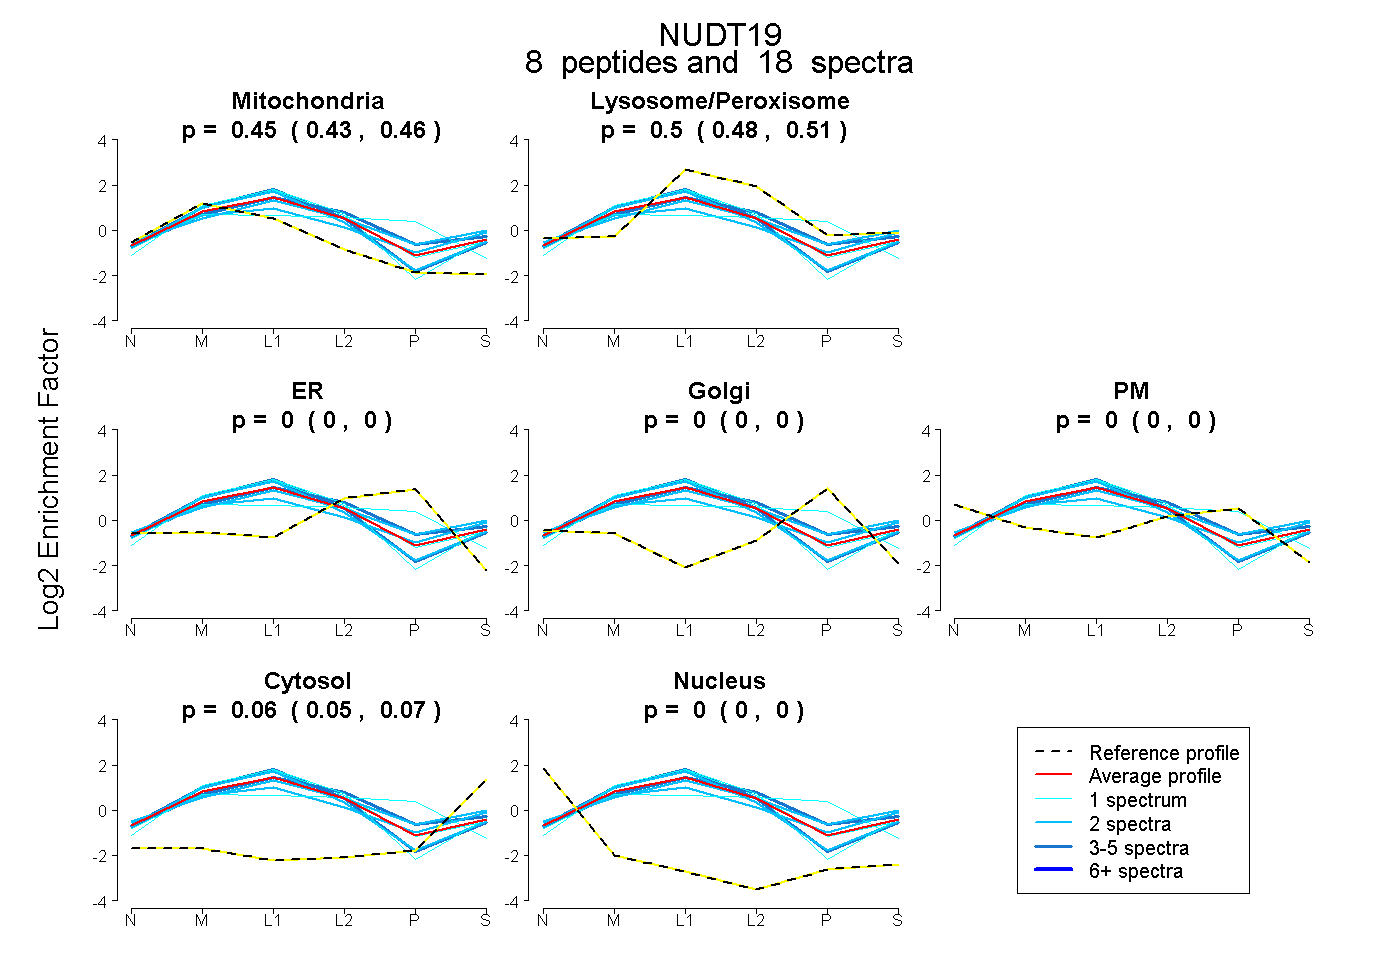 |
0.445 0.429 | 0.459 |
0.496 0.481 | 0.508 |
0.000 0.000 | 0.000 |
0.000 0.000 | 0.000 |
0.000 0.000 | 0.000 |
0.059 0.050 | 0.067 |
0.000 0.000 | 0.000 |
|||
| Plot | Lyso | Other | |||||||||||
| Expt C |
16 peptides |
184 spectra |
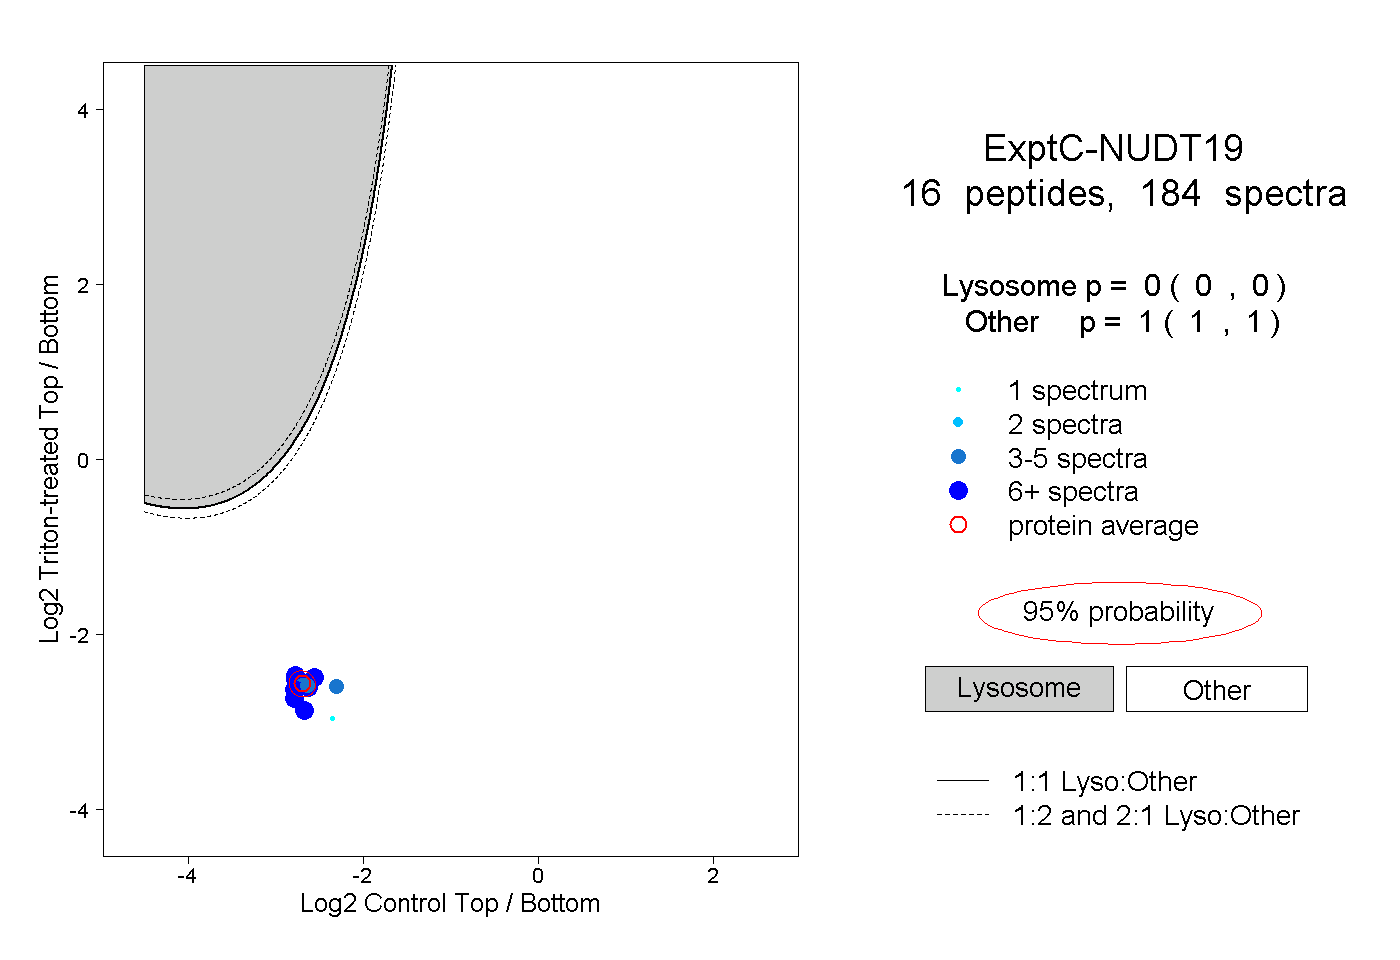 |
0.000 0.000 | 0.000 |
1.000 1.000 | 1.000 |
||||||||
| Plot | Lyso | Other | |||||||||||
| Expt D |
7 peptides |
22 spectra |
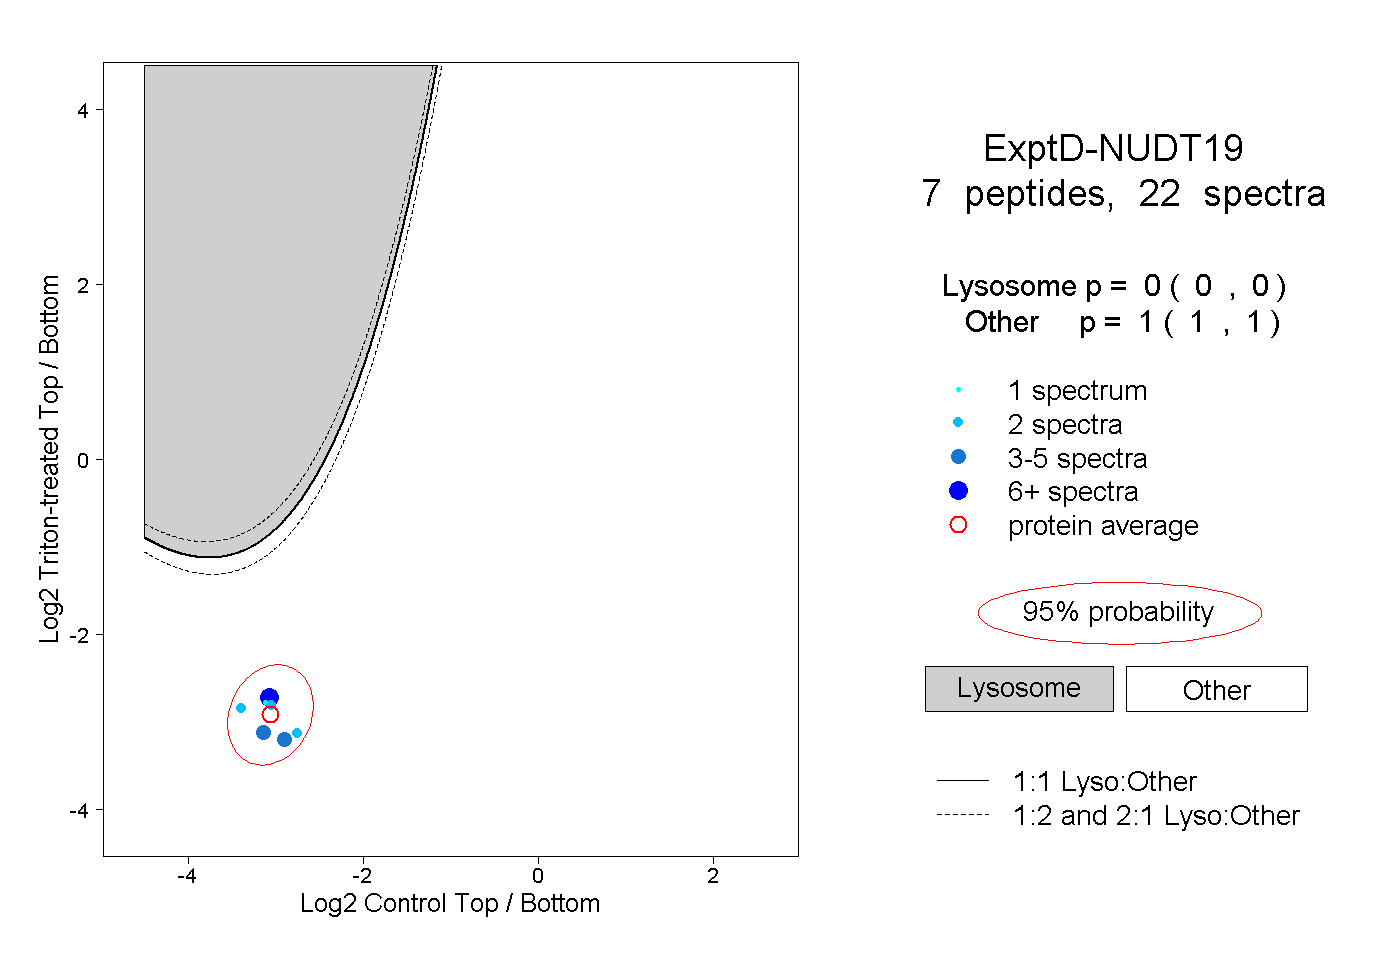 |
0.000 0.000 | 0.000 |
1.000 1.000 | 1.000 |