 3
3peptides
spectra
0.000 | 0.000
0.000 | 0.076
0.000 | 0.121
0.000 | 0.086
0.386 | 0.675
0.000 | 0.245
0.188 | 0.333
0.000 | 0.000
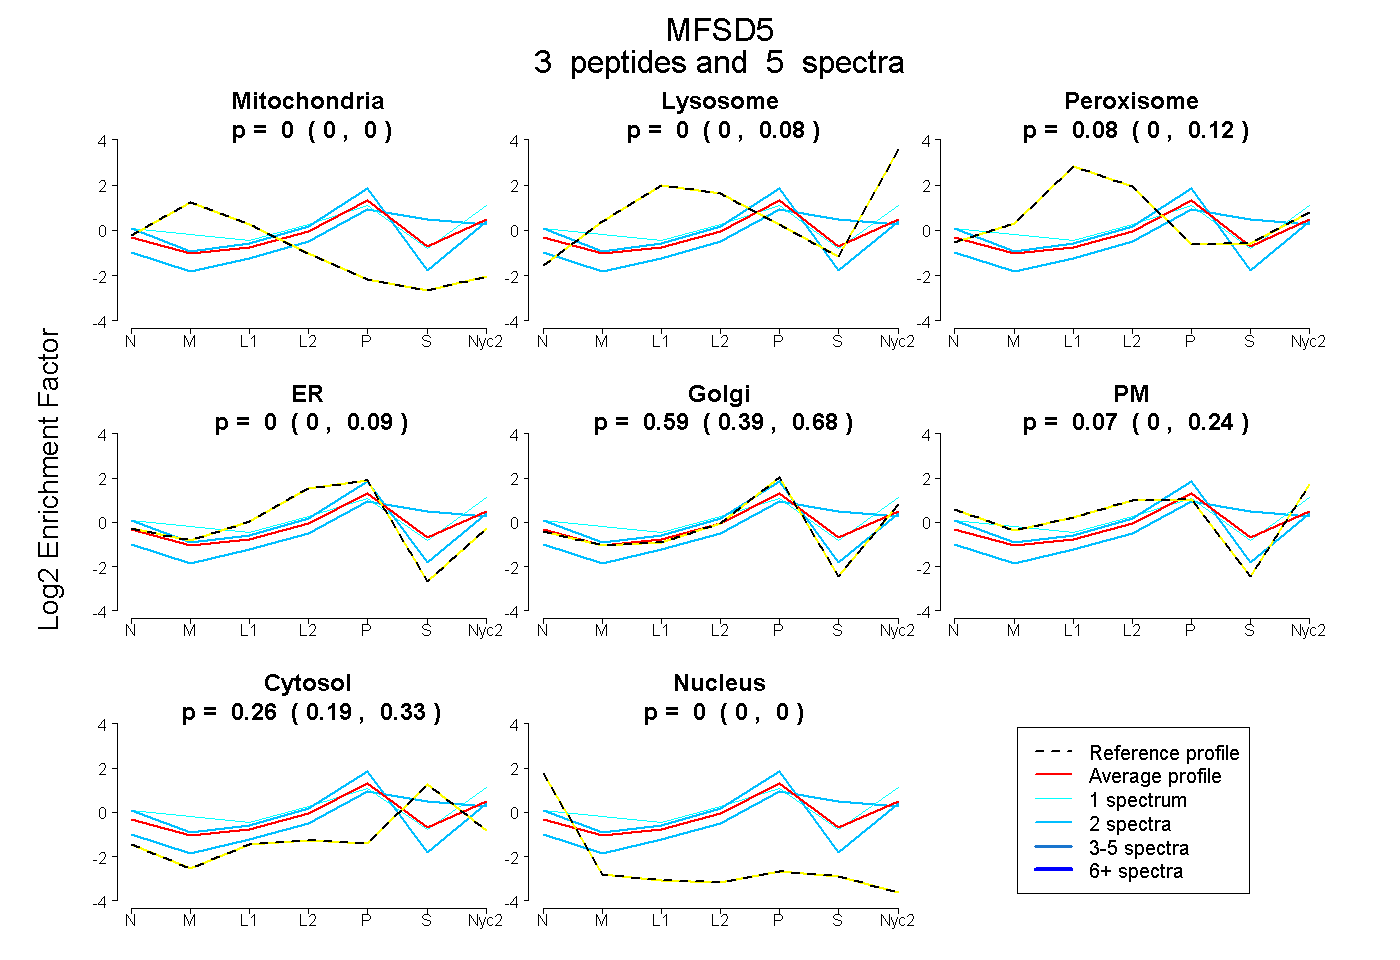
| Plot | Mito | Lyso | Perox | ER | Golgi | PM | Cytosol | Nucleus | |||||
| Expt A |
3 peptides |
5 spectra |
|
0.000 0.000 | 0.000 |
0.000 0.000 | 0.076 |
0.081 0.000 | 0.121 |
0.000 0.000 | 0.086 |
0.592 0.386 | 0.675 |
0.068 0.000 | 0.245 |
0.260 0.188 | 0.333 |
0.000 0.000 | 0.000 |
| 1 spectrum, HDFPAEWIPATFAR | 0.000 | 0.078 | 0.020 | 0.000 | 0.212 | 0.479 | 0.211 | 0.000 | ||
| 2 spectra, TCAGGLR | 0.000 | 0.000 | 0.000 | 0.195 | 0.571 | 0.138 | 0.091 | 0.005 | ||
| 2 spectra, HDAELR | 0.000 | 0.043 | 0.000 | 0.000 | 0.417 | 0.000 | 0.540 | 0.000 |