 3
3peptides
spectra
0.000 | 0.143
0.000 | 0.000
0.000 | 0.094
0.243 | 0.546
0.000 | 0.116
0.000 | 0.000
0.331 | 0.573
0.000 | 0.092
1peptide
spectrum
NA | NA
NA | NA
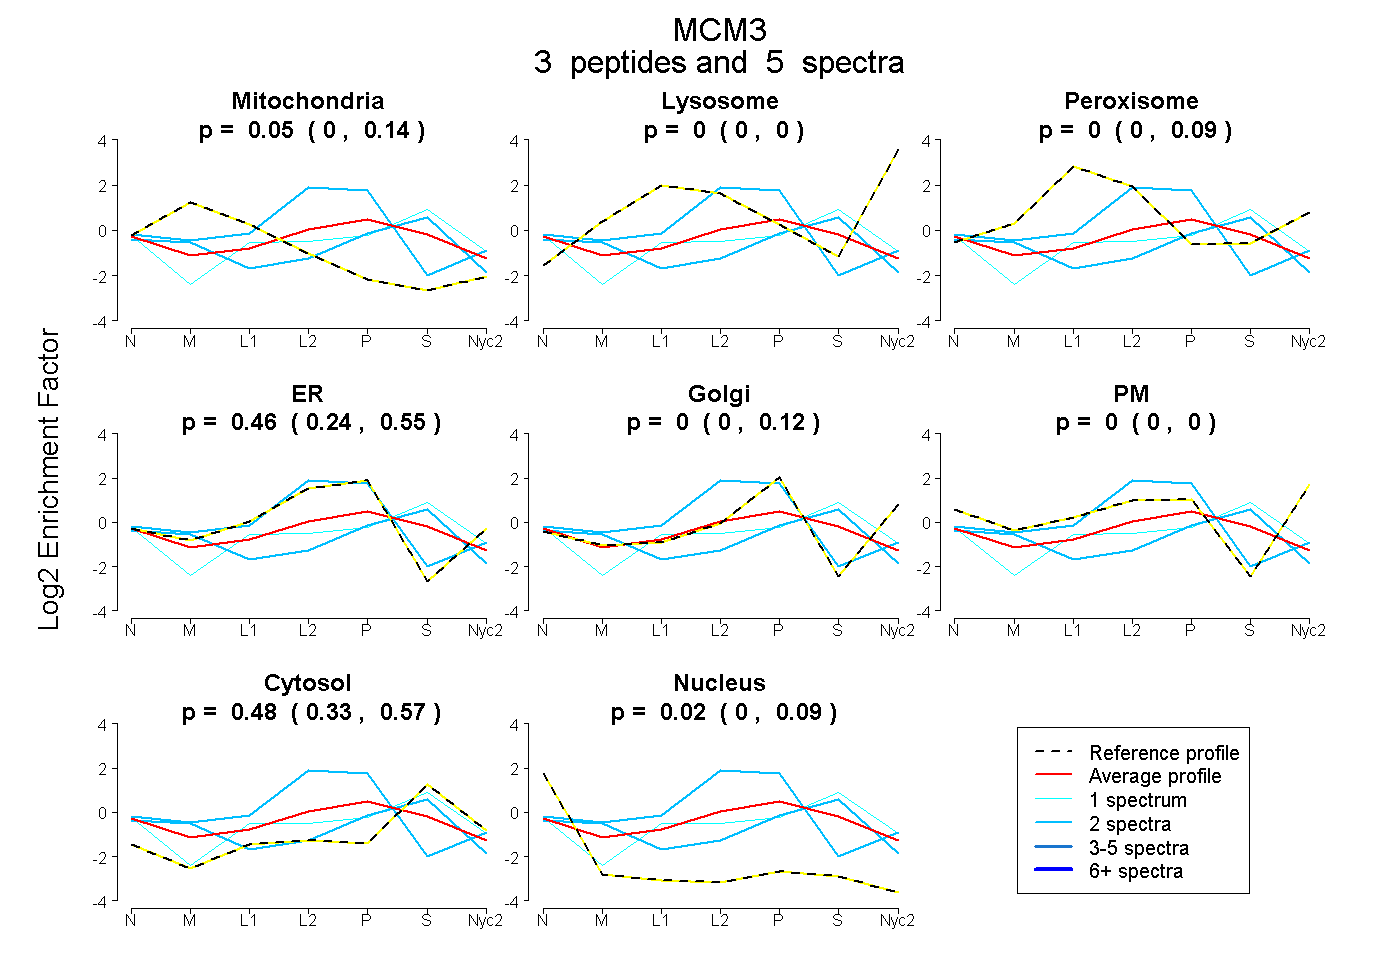
| Plot | Mito | Lyso | Perox | ER | Golgi | PM | Cytosol | Nucleus | |||||
| Expt A |
3 peptides |
5 spectra |
|
0.053 0.000 | 0.143 |
0.000 0.000 | 0.000 |
0.000 0.000 | 0.094 |
0.455 0.243 | 0.546 |
0.000 0.000 | 0.116 |
0.000 0.000 | 0.000 |
0.475 0.331 | 0.573 |
0.017 0.000 | 0.092 |
||
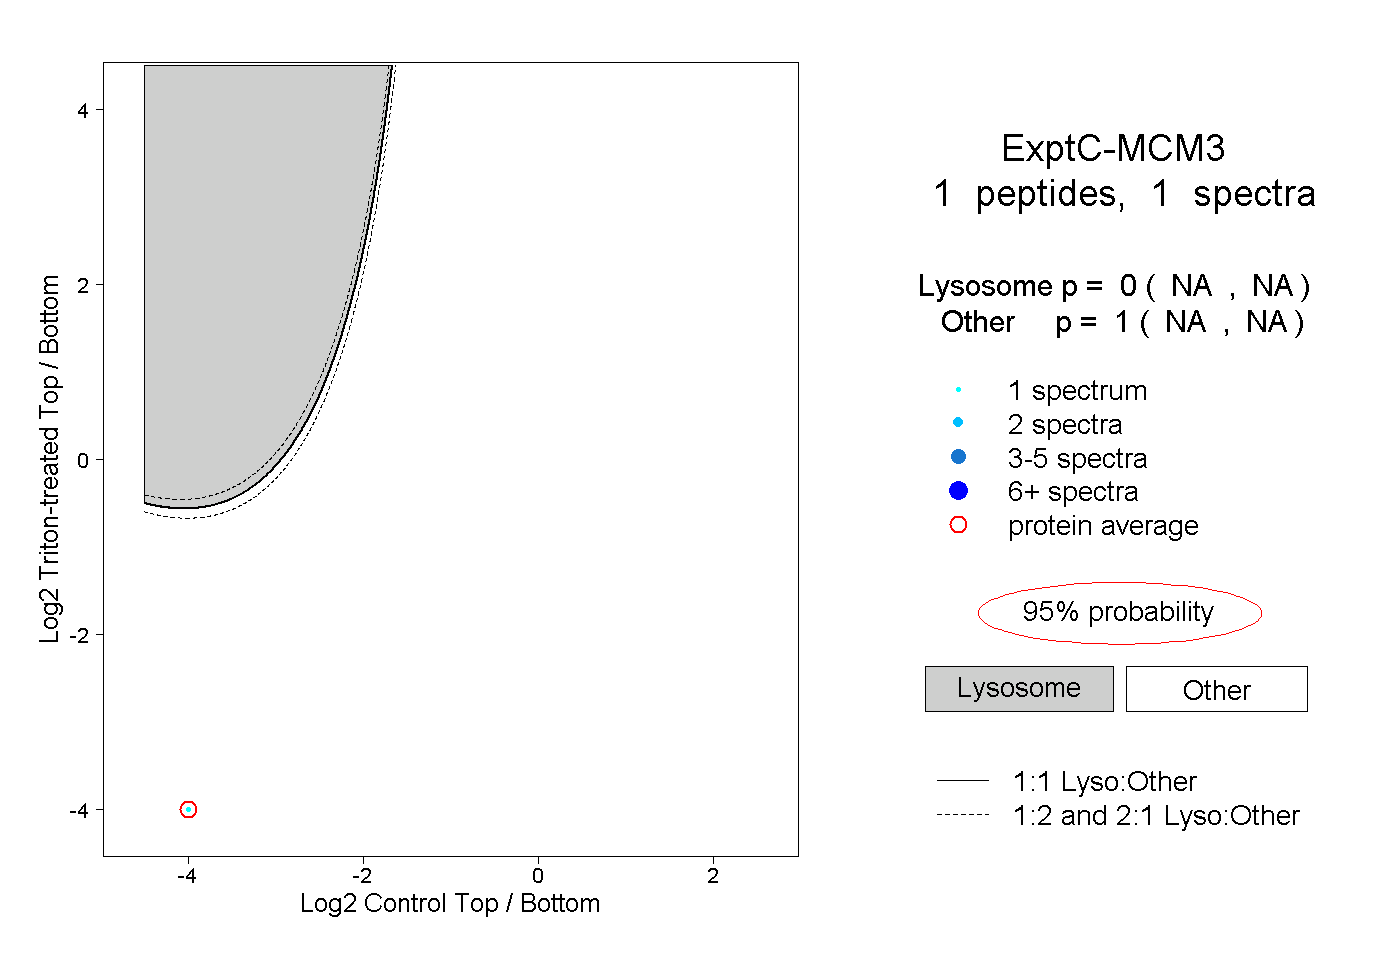
| Plot | Lyso | Other | |||||||||||
| Expt C |
1 peptide |
1 spectrum |
|
0.000 NA | NA |
1.000 NA | NA |