 2
2peptides
spectra
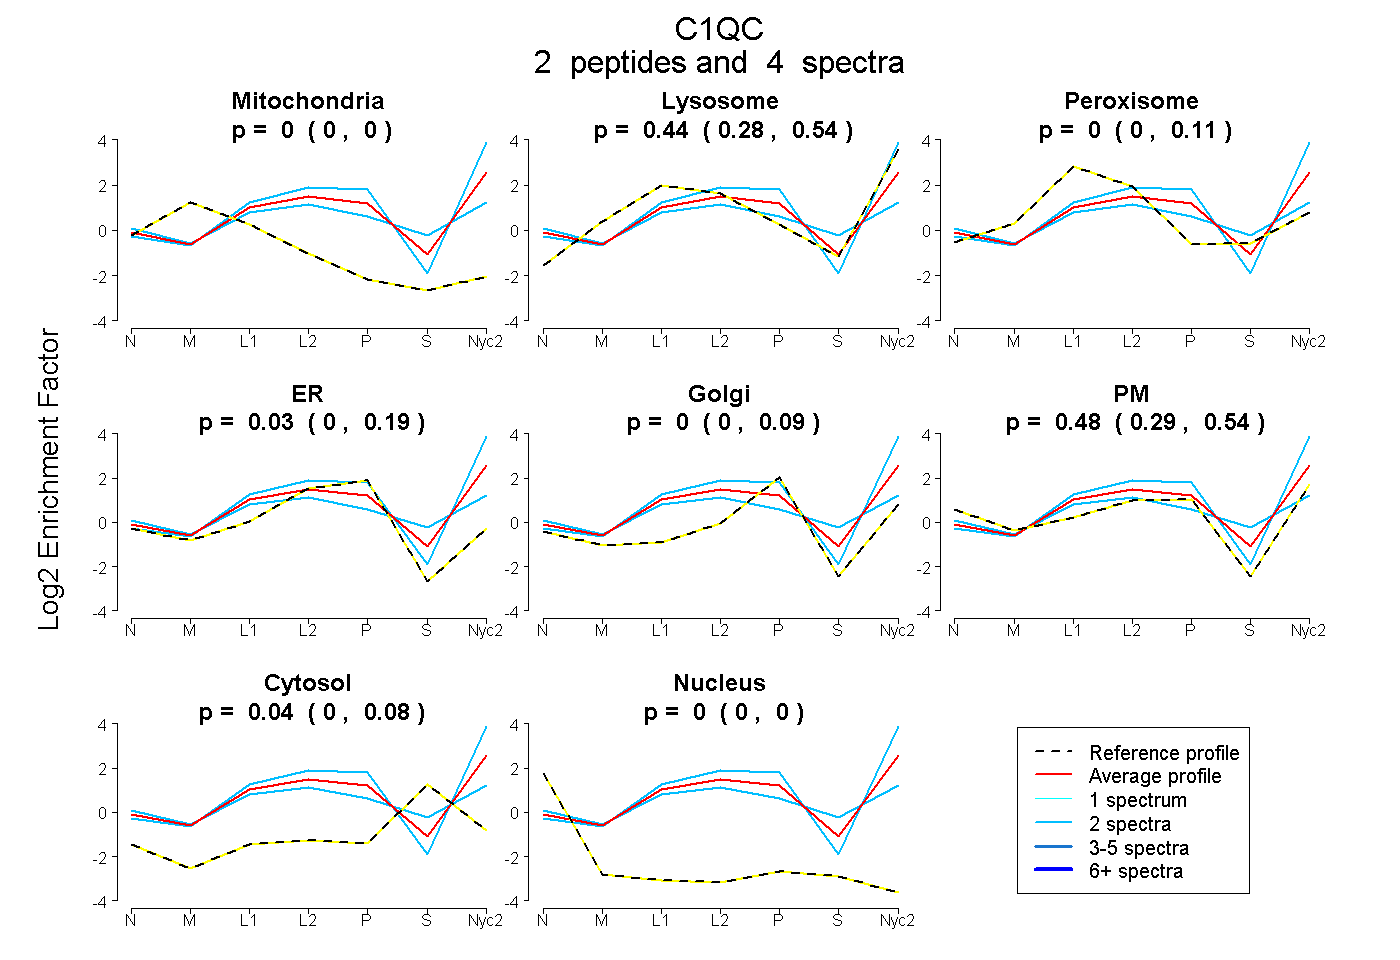
0.000 | 0.000
0.284 | 0.544
0.000 | 0.114
0.000 | 0.187
0.000 | 0.090
0.288 | 0.543
0.000 | 0.084
0.000 | 0.000
2peptides
spectra
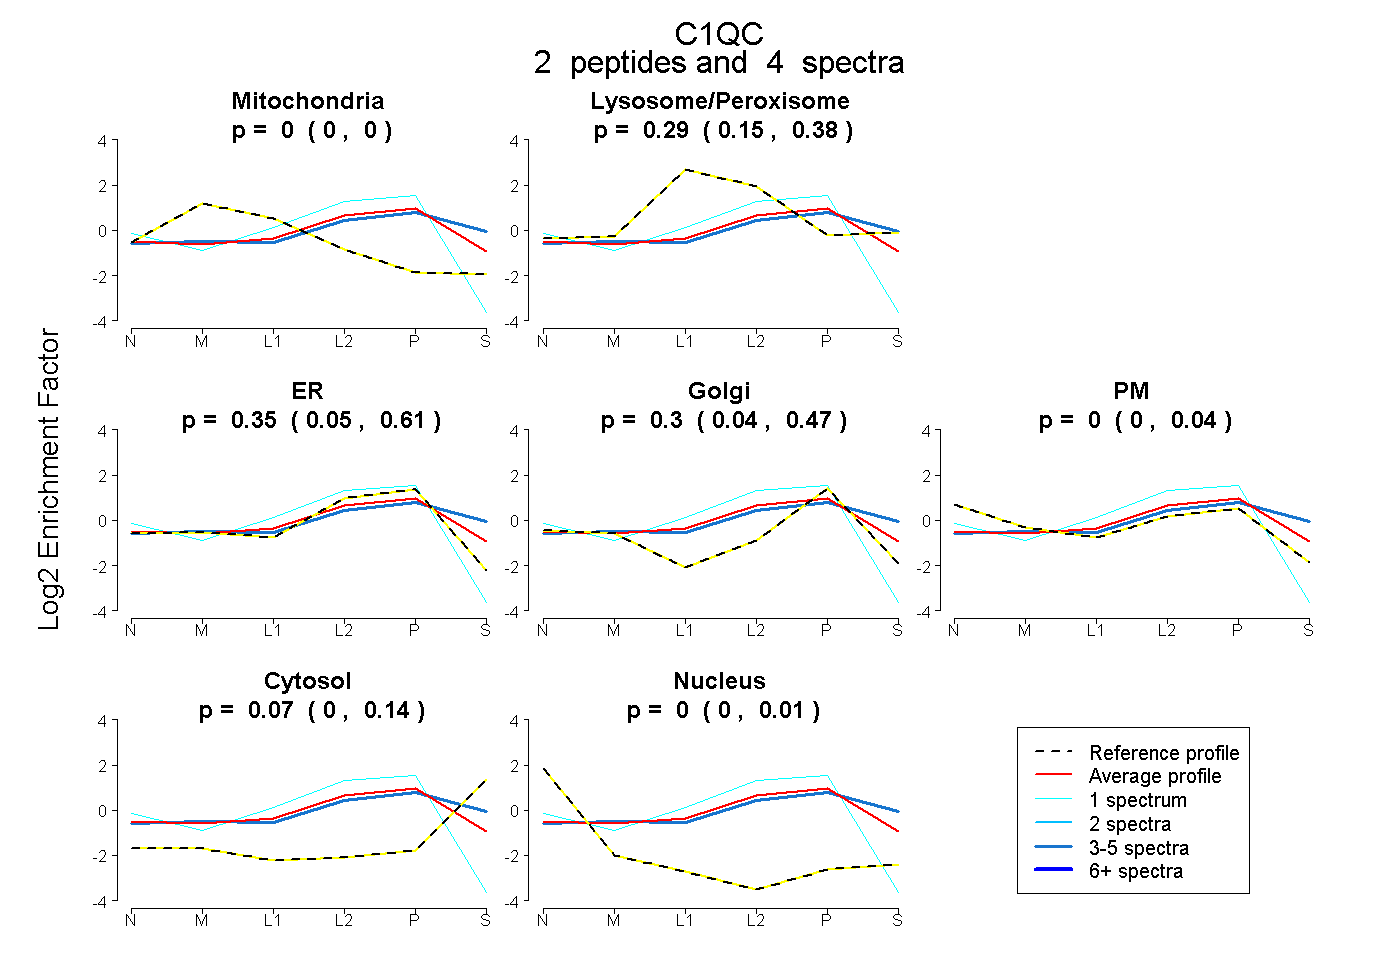
0.000 | 0.000
0.145 | 0.380
0.053 | 0.612
0.043 | 0.468
0.000 | 0.041
0.000 | 0.141
0.000 | 0.013
5peptides
spectra
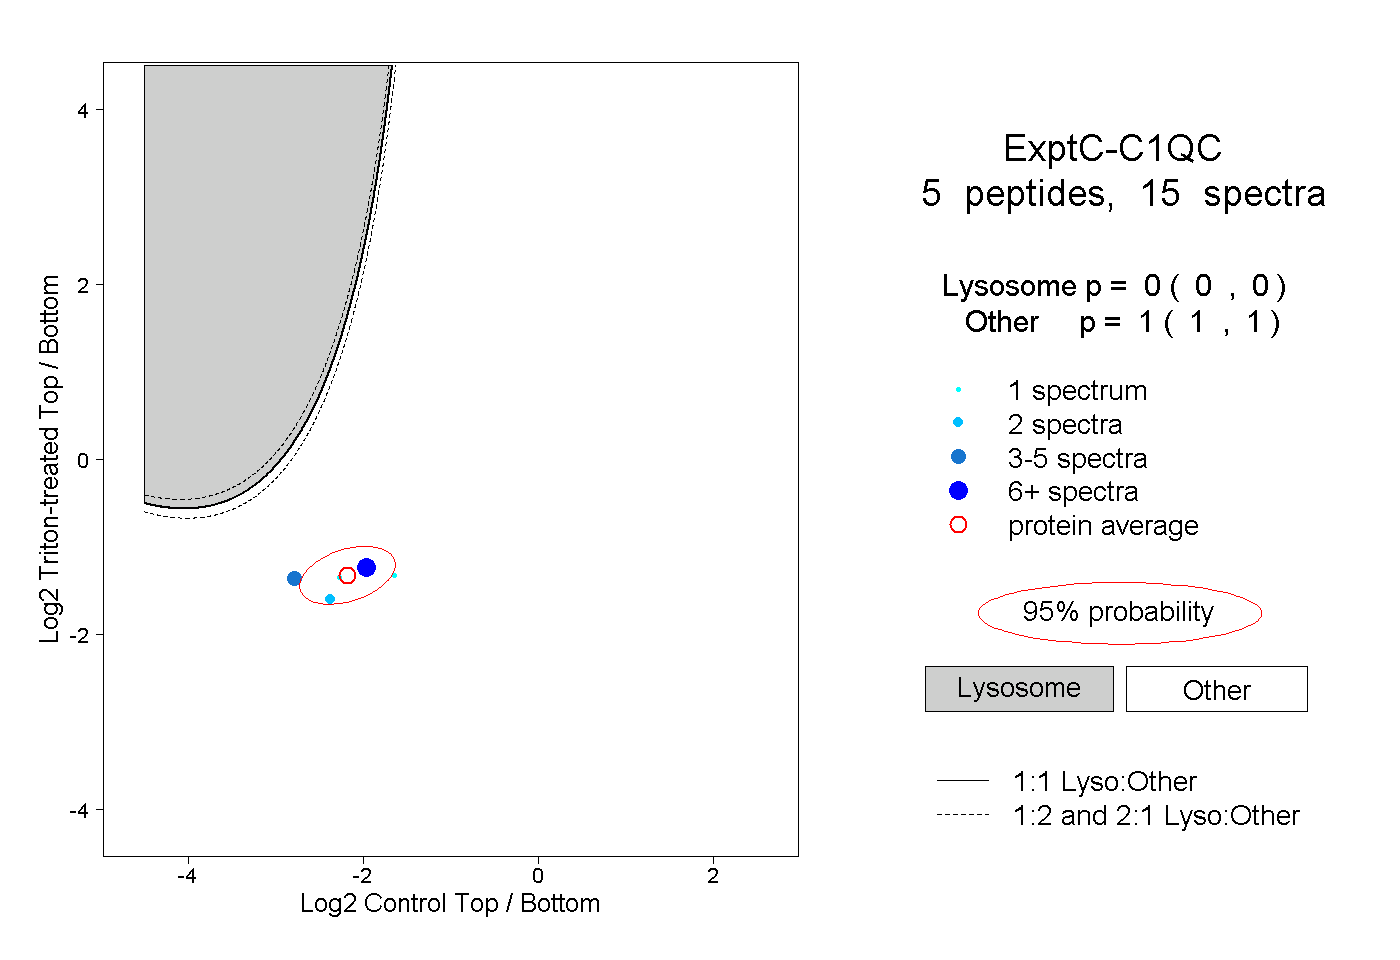
0.000 | 0.000
1.000 | 1.000
2peptides
spectra
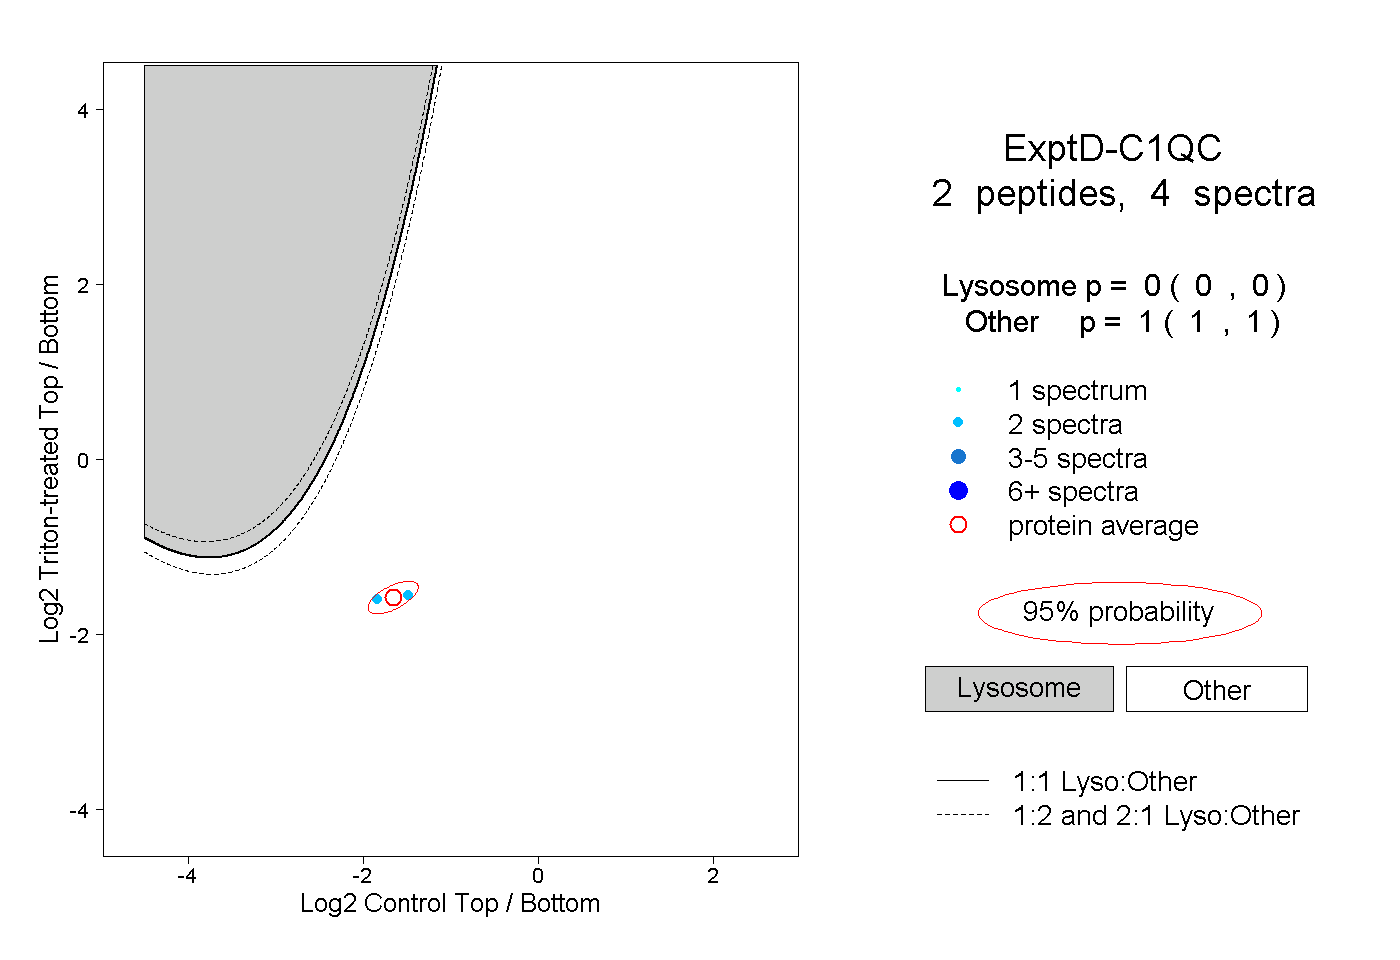
0.000 | 0.000
1.000 | 1.000