 7
7peptides
spectra
0.023 | 0.036
0.000 | 0.000
0.000 | 0.003
0.911 | 0.923
0.000 | 0.000
0.000 | 0.000
0.037 | 0.055
0.000 | 0.009
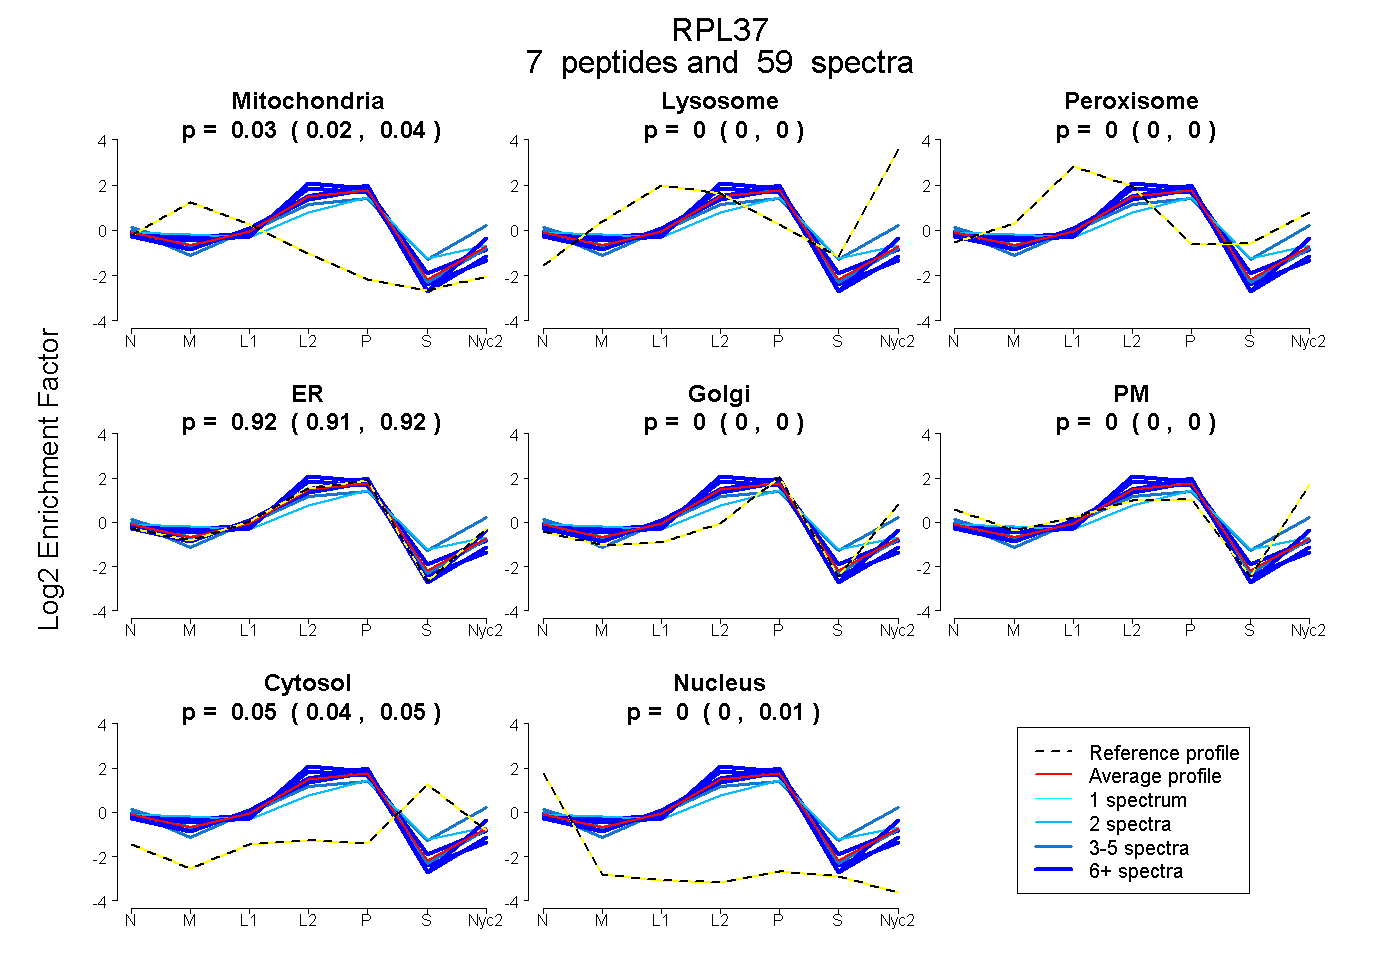
| Plot | Mito | Lyso | Perox | ER | Golgi | PM | Cytosol | Nucleus | |||||
| Expt A |
7 peptides |
59 spectra |
|
0.031 0.023 | 0.036 |
0.000 0.000 | 0.000 |
0.000 0.000 | 0.003 |
0.918 0.911 | 0.923 |
0.000 0.000 | 0.000 |
0.000 0.000 | 0.000 |
0.047 0.037 | 0.055 |
0.004 0.000 | 0.009 |
| 5 spectra, EGTTPKPK | 0.000 | 0.000 | 0.000 | 0.948 | 0.000 | 0.000 | 0.021 | 0.031 | ||
| 4 spectra, ATVAASSSS | 0.000 | 0.000 | 0.075 | 0.506 | 0.000 | 0.272 | 0.147 | 0.000 | ||
| 2 spectra, THTLCR | 0.079 | 0.000 | 0.036 | 0.673 | 0.048 | 0.000 | 0.164 | 0.000 | ||
| 18 spectra, AYHLQK | 0.000 | 0.000 | 0.029 | 0.880 | 0.000 | 0.000 | 0.074 | 0.017 | ||
| 6 spectra, CGYPAK | 0.097 | 0.000 | 0.000 | 0.903 | 0.000 | 0.000 | 0.000 | 0.000 | ||
| 16 spectra, GTSSFGK | 0.000 | 0.000 | 0.000 | 0.960 | 0.000 | 0.000 | 0.000 | 0.039 | ||
| 8 spectra, YNWSAK | 0.000 | 0.000 | 0.000 | 1.000 | 0.000 | 0.000 | 0.000 | 0.000 |
| Plot | Mito | Lyso or Perox | ER | Golgi | PM | Cytosol | Nucleus | ||||||
| Expt B |
3 peptides |
8 spectra |
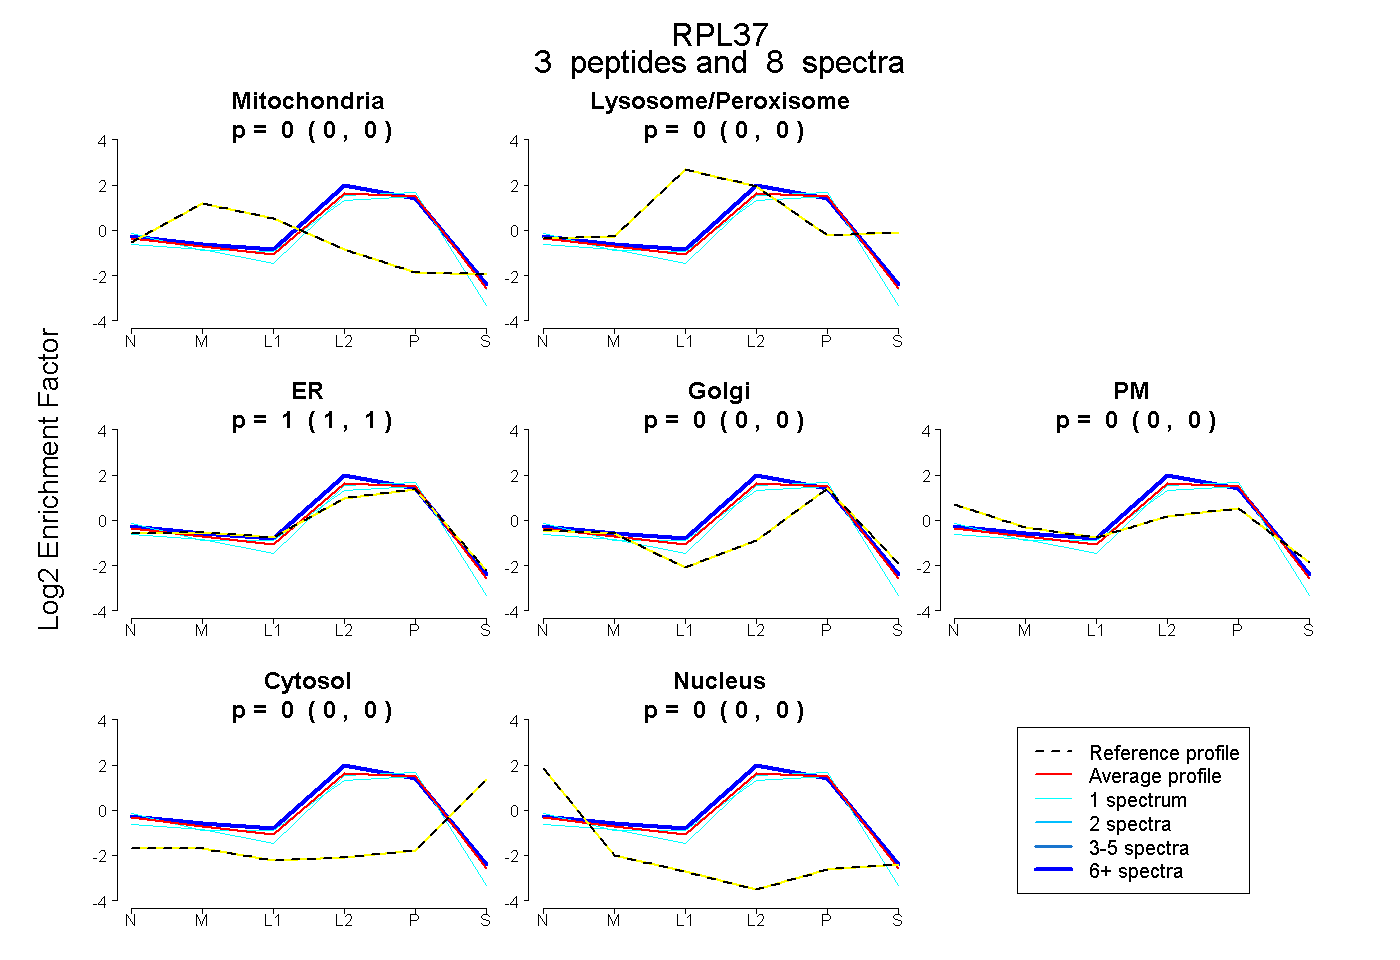 |
0.000 0.000 | 0.000 |
0.000 0.000 | 0.000 |
1.000 1.000 | 1.000 |
0.000 0.000 | 0.000 |
0.000 0.000 | 0.000 |
0.000 0.000 | 0.000 |
0.000 0.000 | 0.000 |
|||
| Plot | Lyso | Other | |||||||||||
| Expt C |
6 peptides |
145 spectra |
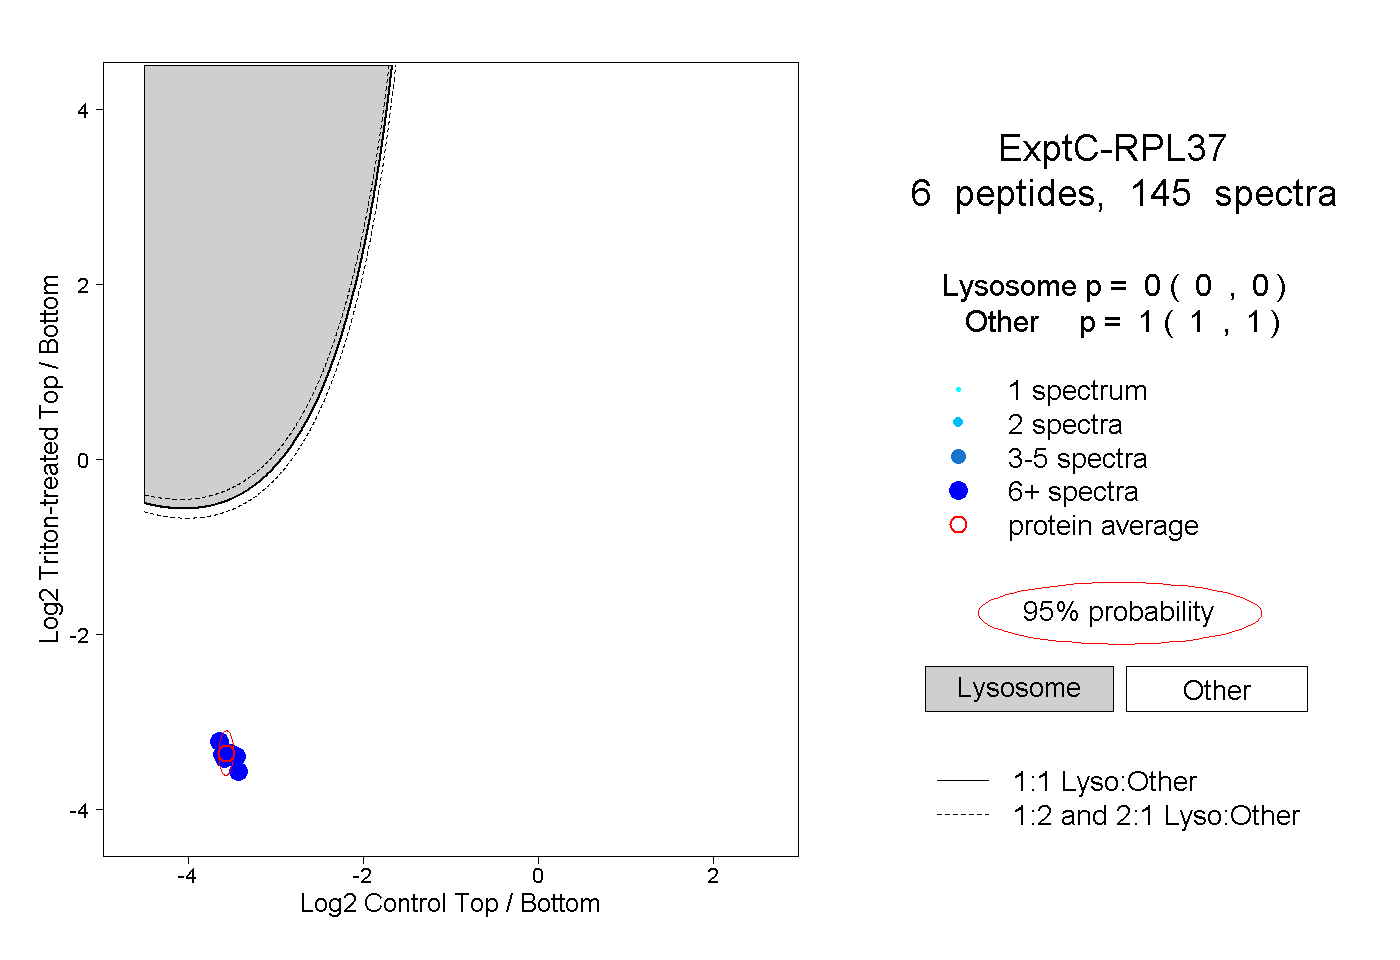 |
0.000 0.000 | 0.000 |
1.000 1.000 | 1.000 |
||||||||
| Plot | Lyso | Other | |||||||||||
| Expt D |
4 peptides |
7 spectra |
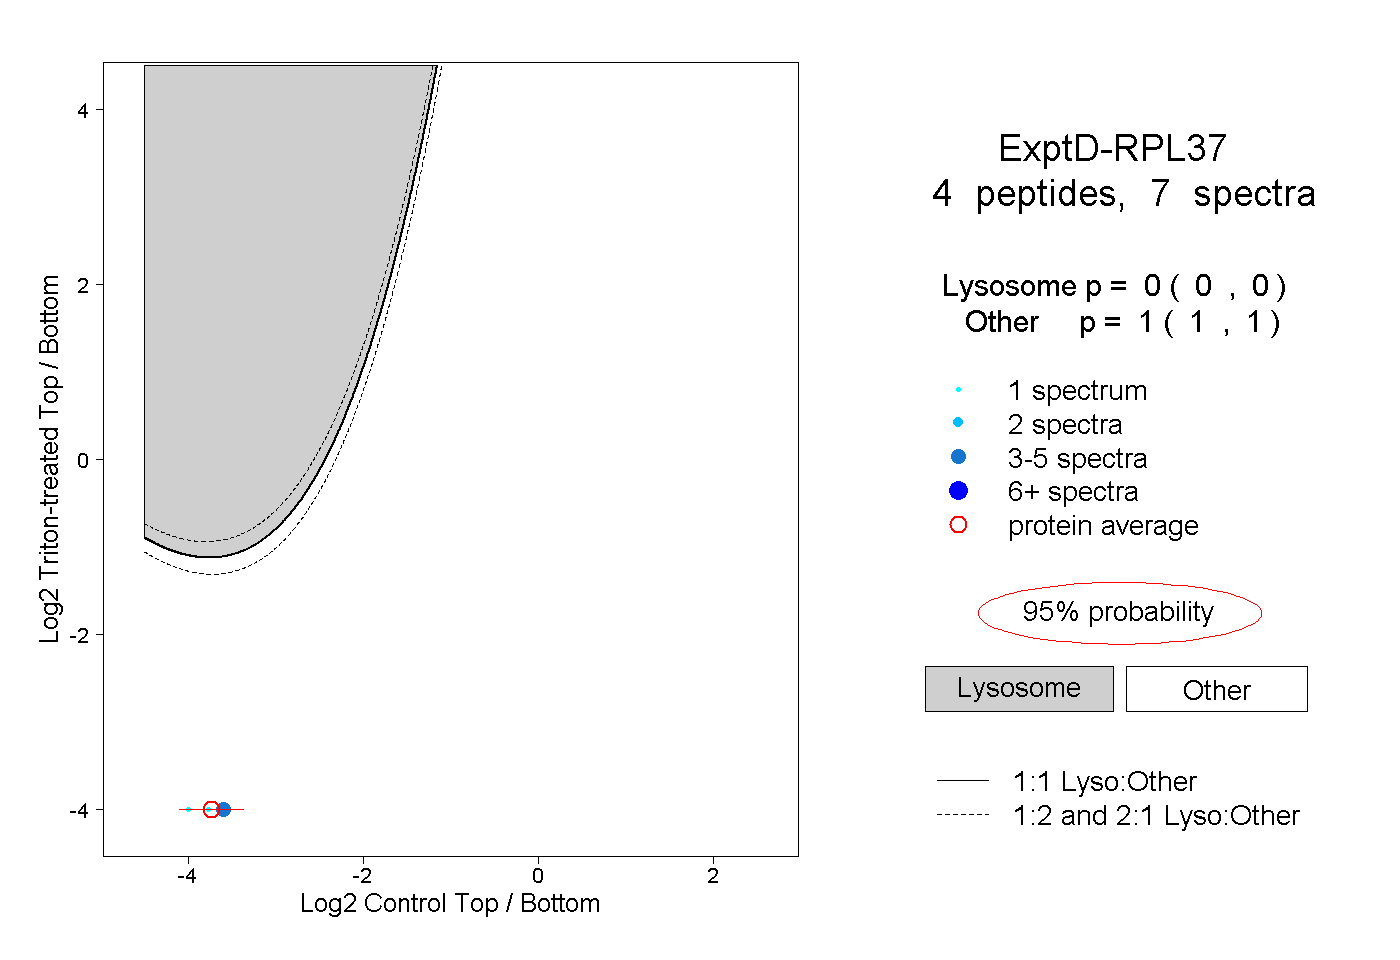 |
0.000 0.000 | 0.000 |
1.000 1.000 | 1.000 |