 13
13peptides
spectra
0.000 | 0.000
1.000 | 1.000
0.000 | 0.000
0.000 | 0.000
0.000 | 0.000
0.000 | 0.000
0.000 | 0.000
0.000 | 0.000
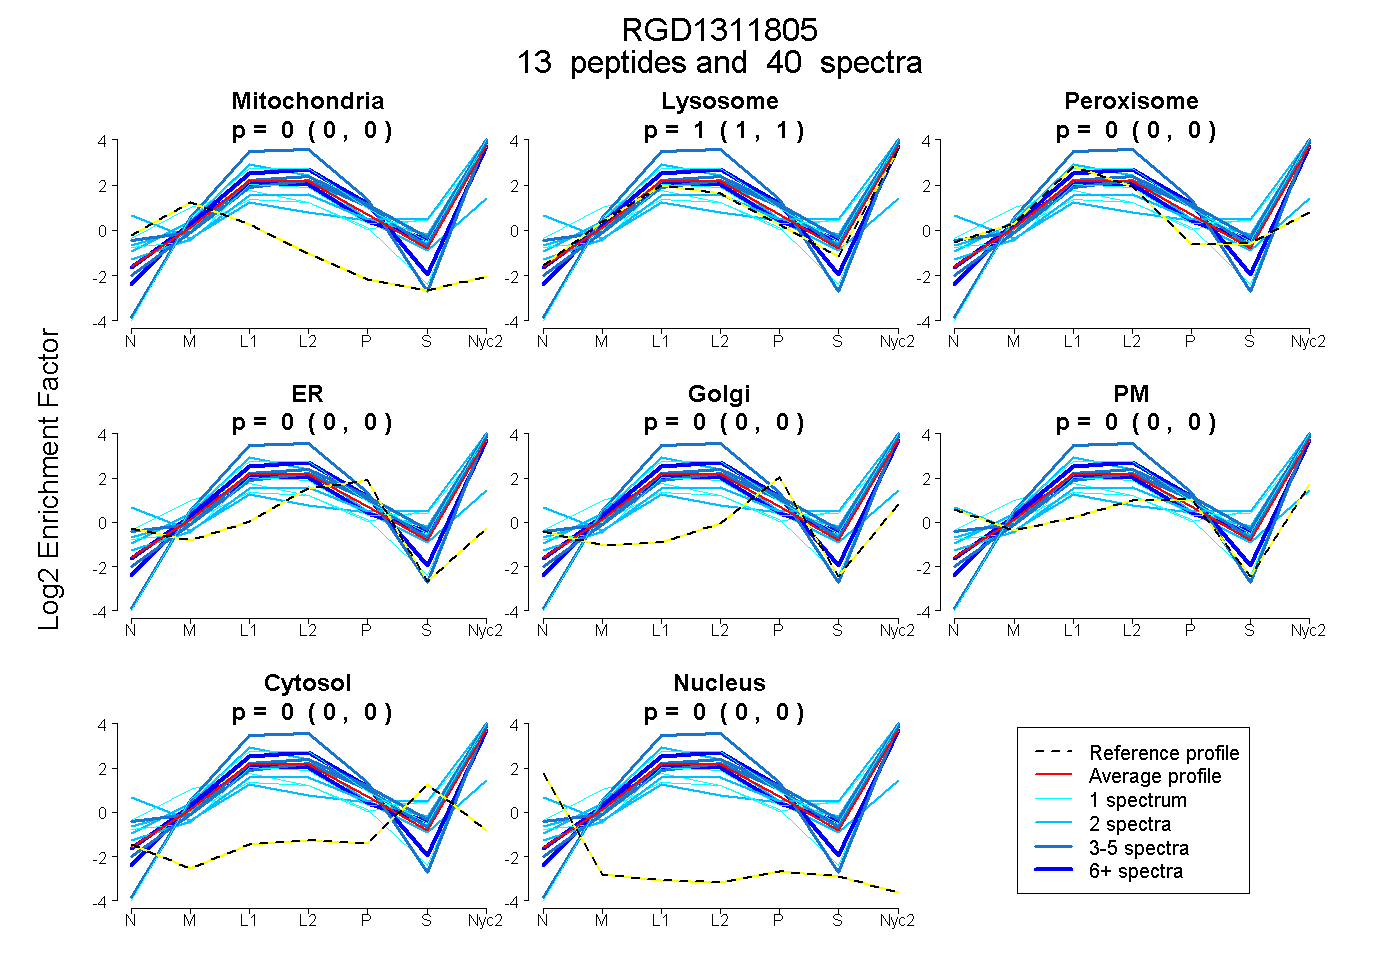
| Plot | Mito | Lyso | Perox | ER | Golgi | PM | Cytosol | Nucleus | |||||
| Expt A |
13 peptides |
40 spectra |
|
0.000 0.000 | 0.000 |
1.000 1.000 | 1.000 |
0.000 0.000 | 0.000 |
0.000 0.000 | 0.000 |
0.000 0.000 | 0.000 |
0.000 0.000 | 0.000 |
0.000 0.000 | 0.000 |
0.000 0.000 | 0.000 |
| 9 spectra, HQVLAALR | 0.000 | 0.997 | 0.000 | 0.003 | 0.000 | 0.000 | 0.000 | 0.000 | ||
| 2 spectra, GIGGHDNISAR | 0.000 | 0.974 | 0.026 | 0.000 | 0.000 | 0.000 | 0.000 | 0.000 | ||
| 3 spectra, NPISFR | 0.000 | 0.876 | 0.000 | 0.000 | 0.000 | 0.124 | 0.000 | 0.000 | ||
| 1 spectrum, SGGATGVVVK | 0.000 | 1.000 | 0.000 | 0.000 | 0.000 | 0.000 | 0.000 | 0.000 | ||
| 3 spectra, QVFAVR | 0.000 | 1.000 | 0.000 | 0.000 | 0.000 | 0.000 | 0.000 | 0.000 | ||
| 2 spectra, QTDDVMLFYTIFR | 0.000 | 0.899 | 0.000 | 0.000 | 0.000 | 0.000 | 0.101 | 0.000 | ||
| 5 spectra, LMDFLLQR | 0.000 | 1.000 | 0.000 | 0.000 | 0.000 | 0.000 | 0.000 | 0.000 | ||
| 1 spectrum, GEFDGTVTFHHPVLPAR | 0.000 | 0.745 | 0.000 | 0.000 | 0.000 | 0.255 | 0.000 | 0.000 | ||
| 2 spectra, GSEDYYLELCERPVQFEK | 0.000 | 0.950 | 0.050 | 0.000 | 0.000 | 0.000 | 0.000 | 0.000 | ||
| 1 spectrum, QAFGEQALMRPTTF | 0.000 | 0.855 | 0.067 | 0.000 | 0.000 | 0.000 | 0.078 | 0.000 | ||
| 8 spectra, ILAVQR | 0.000 | 1.000 | 0.000 | 0.000 | 0.000 | 0.000 | 0.000 | 0.000 | ||
| 2 spectra, AVVLSVCSQMLSESDR | 0.000 | 0.000 | 0.361 | 0.000 | 0.000 | 0.551 | 0.089 | 0.000 | ||
| 1 spectrum, FSLENK | 0.000 | 0.880 | 0.000 | 0.000 | 0.000 | 0.000 | 0.120 | 0.000 |
| Plot | Mito | Lyso or Perox | ER | Golgi | PM | Cytosol | Nucleus | ||||||
| Expt B |
9 peptides |
18 spectra |
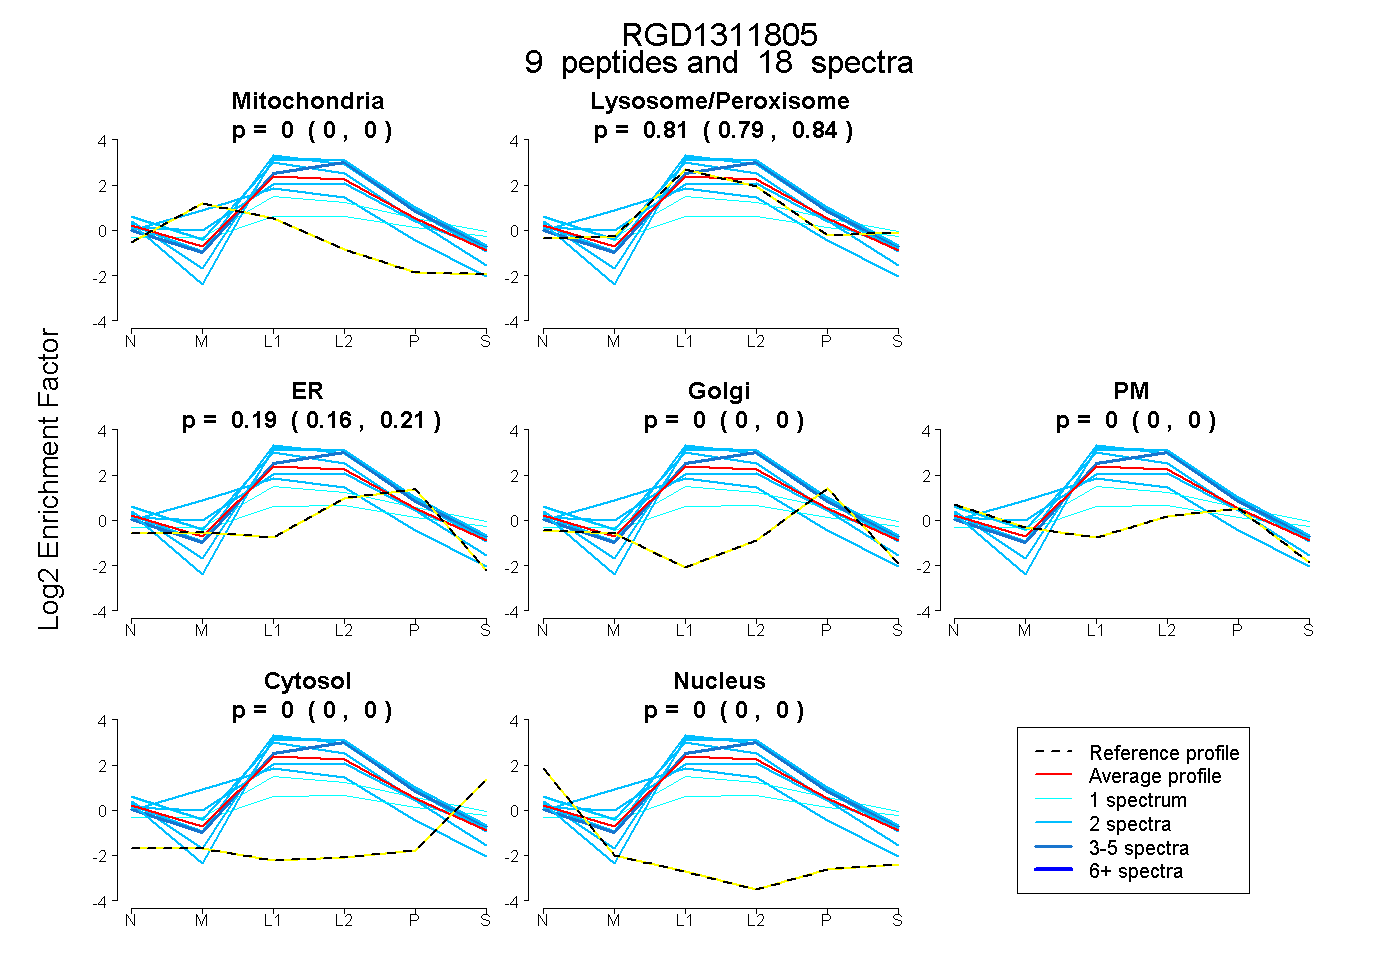 |
0.000 0.000 | 0.000 |
0.815 0.786 | 0.837 |
0.185 0.160 | 0.209 |
0.000 0.000 | 0.000 |
0.000 0.000 | 0.000 |
0.000 0.000 | 0.000 |
0.000 0.000 | 0.000 |
|||
| Plot | Lyso | Other | |||||||||||
| Expt C |
24 peptides |
137 spectra |
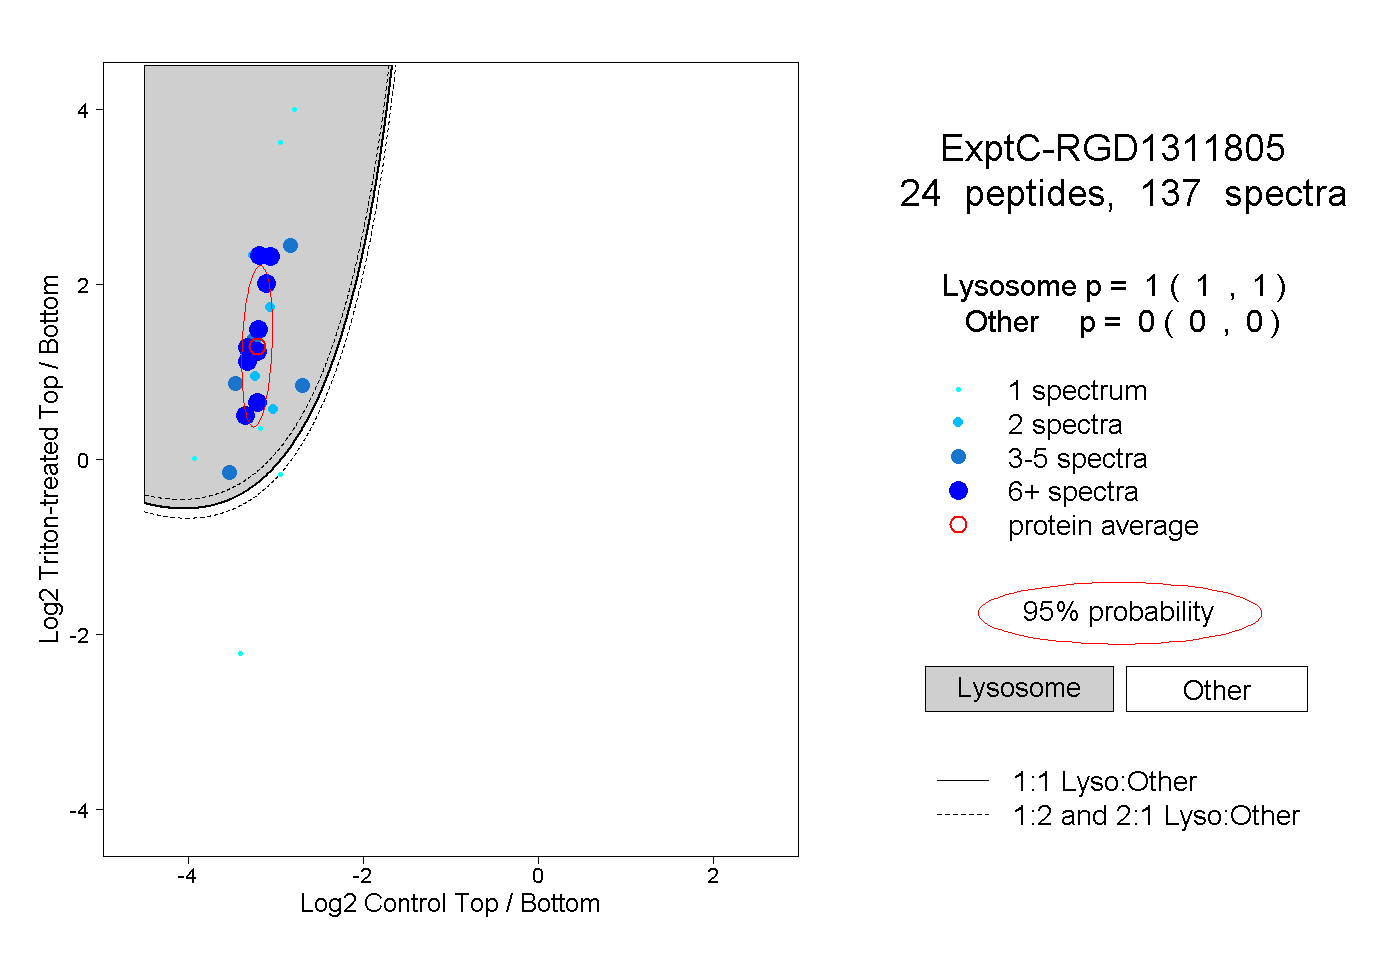 |
1.000 1.000 | 1.000 |
0.000 0.000 | 0.000 |
||||||||
| Plot | Lyso | Other | |||||||||||
| Expt D |
7 peptides |
9 spectra |
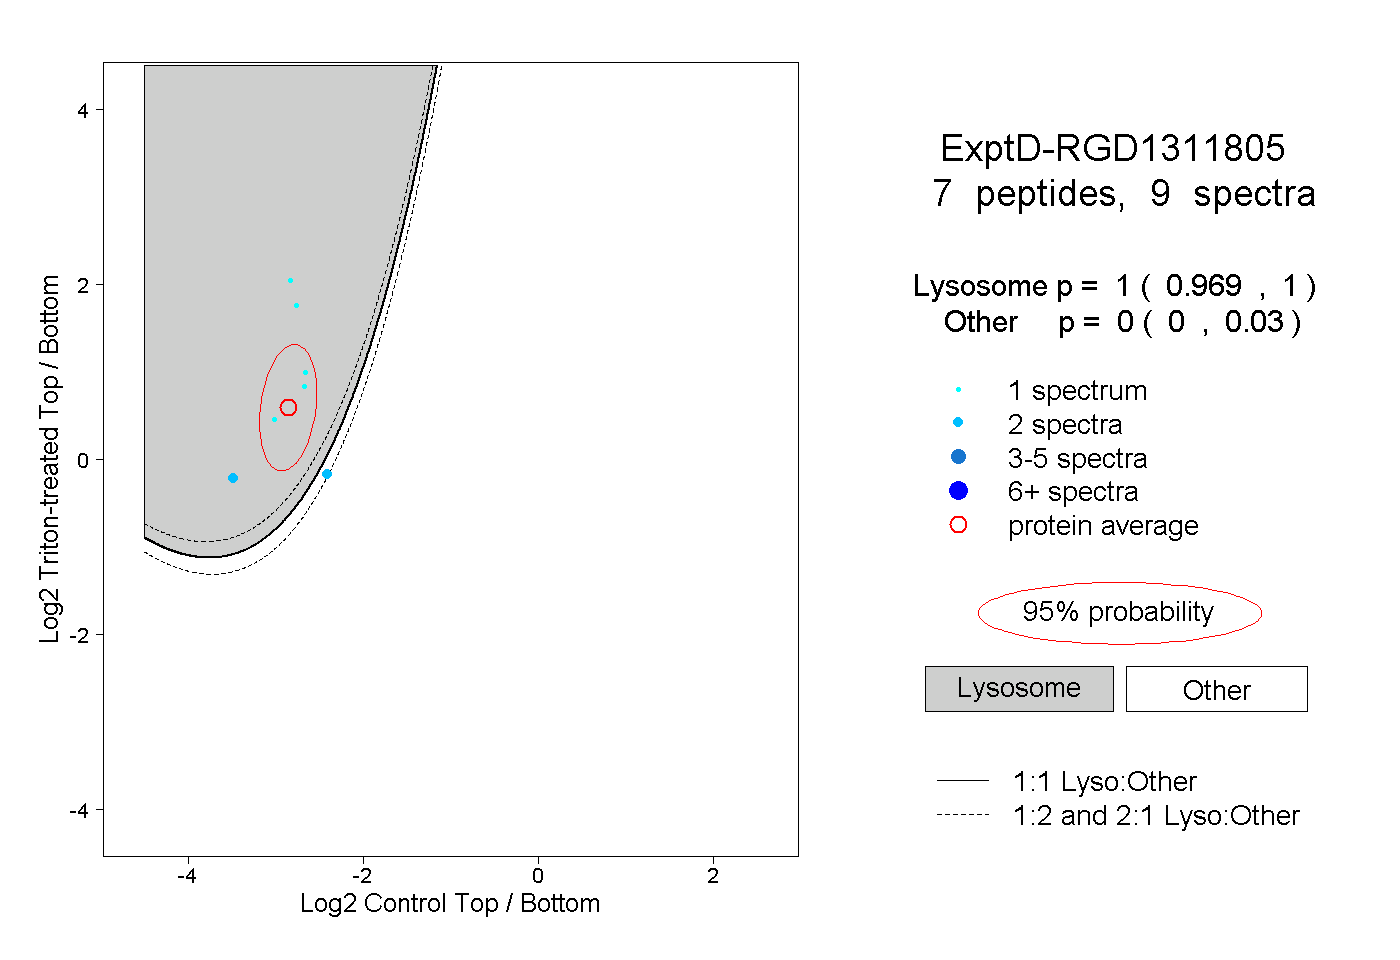 |
1.000 0.969 | 1.000 |
0.000 0.000 | 0.030 |