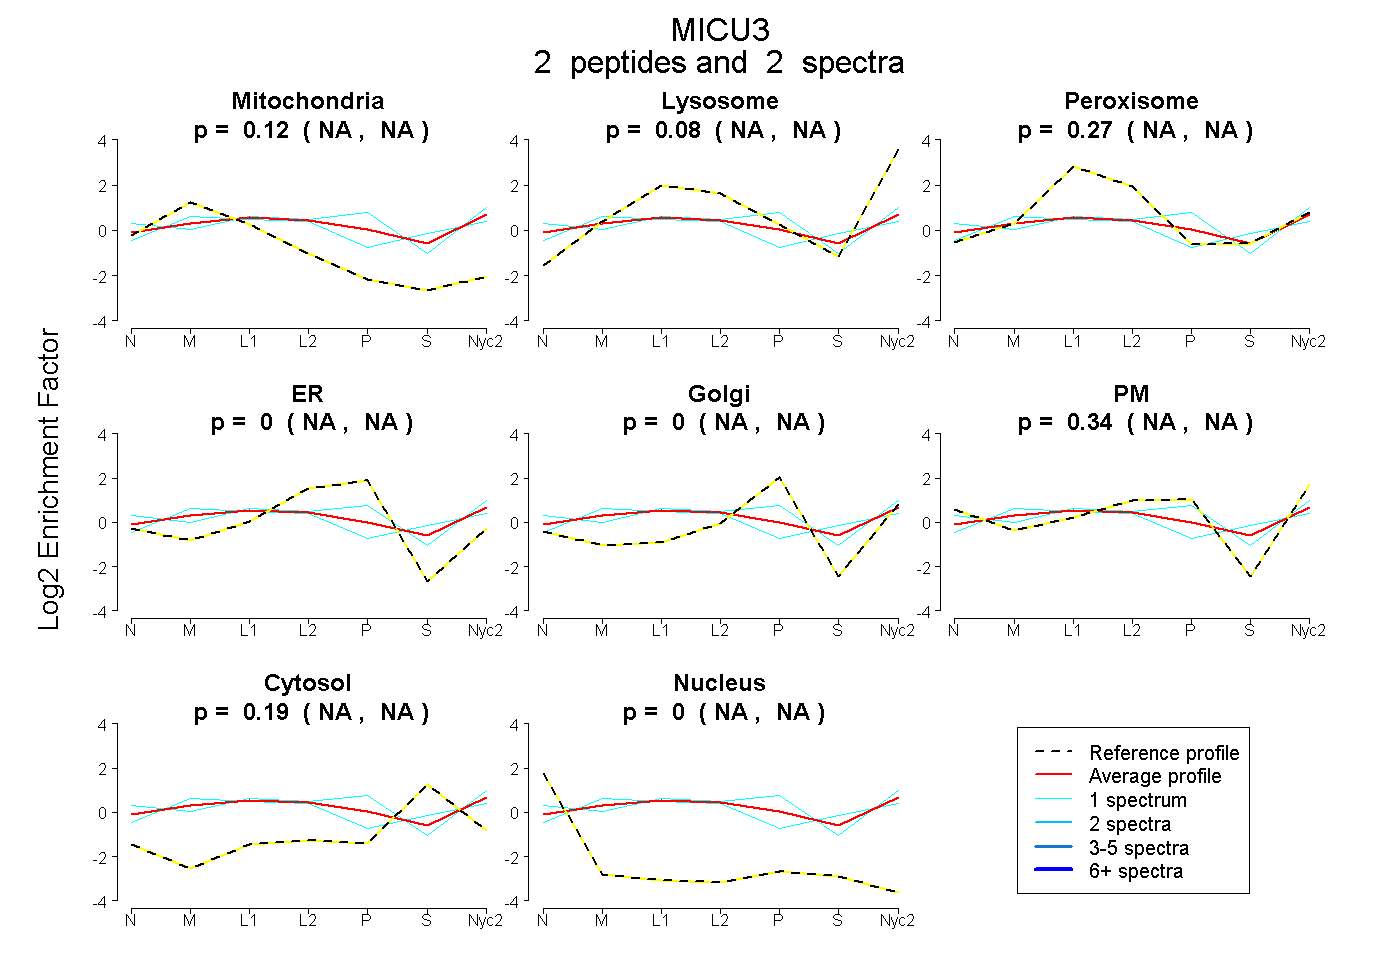
 2
2peptides
spectra
NA | NA
NA | NA
NA | NA
NA | NA
NA | NA
NA | NA
NA | NA
NA | NA
| Plot | Mito | Lyso | Perox | ER | Golgi | PM | Cytosol | Nucleus | |||||
| Expt A |
2 peptides |
2 spectra |
|
0.117 NA | NA |
0.077 NA | NA |
0.271 NA | NA |
0.000 NA | NA |
0.000 NA | NA |
0.344 NA | NA |
0.191 NA | NA |
0.000 NA | NA |
| 1 spectrum, ADPSELVAPELDESPR | 0.017 | 0.000 | 0.275 | 0.000 | 0.137 | 0.469 | 0.102 | 0.000 | ||
| 1 spectrum, AELNFEDFYR | 0.228 | 0.197 | 0.284 | 0.000 | 0.000 | 0.044 | 0.247 | 0.000 |
| Plot | Lyso | Other | |||||||||||
| Expt C |
5 peptides |
11 spectra |
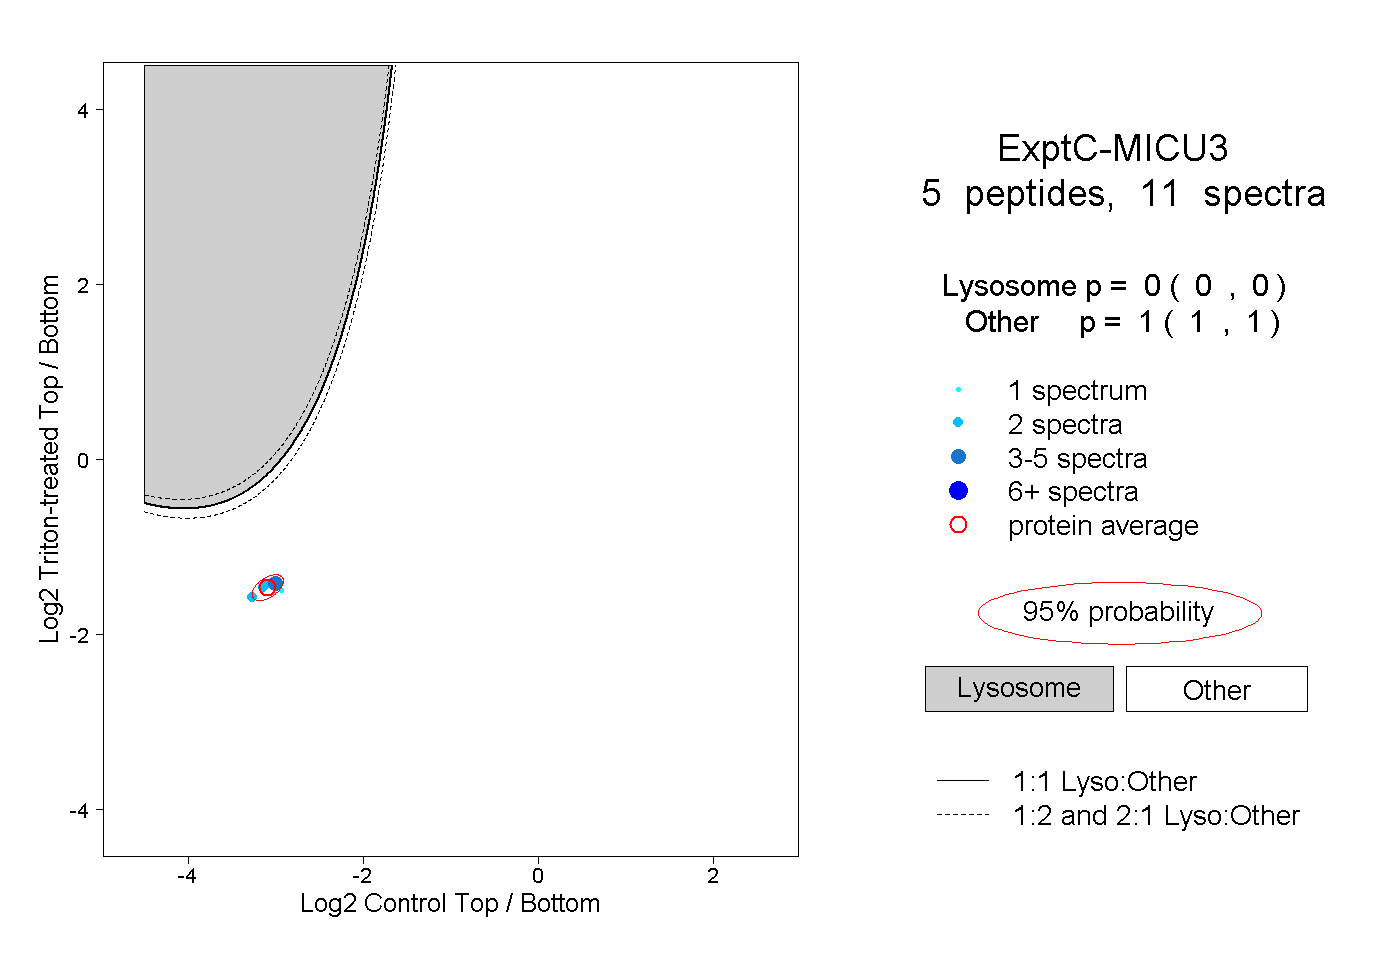 |
0.000 0.000 | 0.000 |
1.000 1.000 | 1.000 |