13
13peptides
spectra
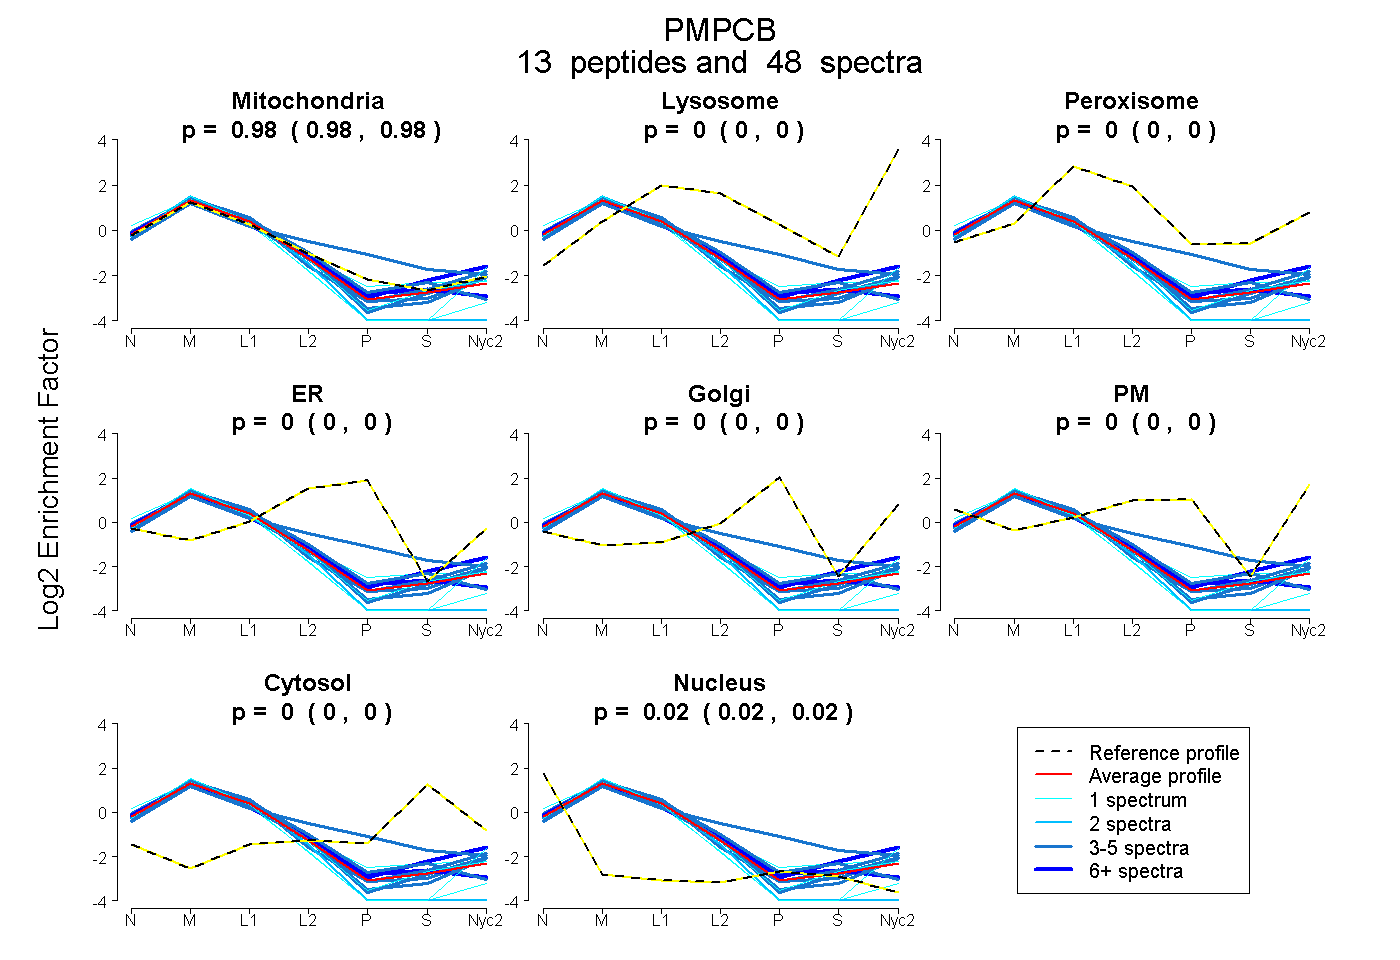
0.977 | 0.983
0.000 | 0.000
0.000 | 0.000
0.000 | 0.000
0.000 | 0.000
0.000 | 0.000
0.000 | 0.000
0.017 | 0.022
7peptides
spectra
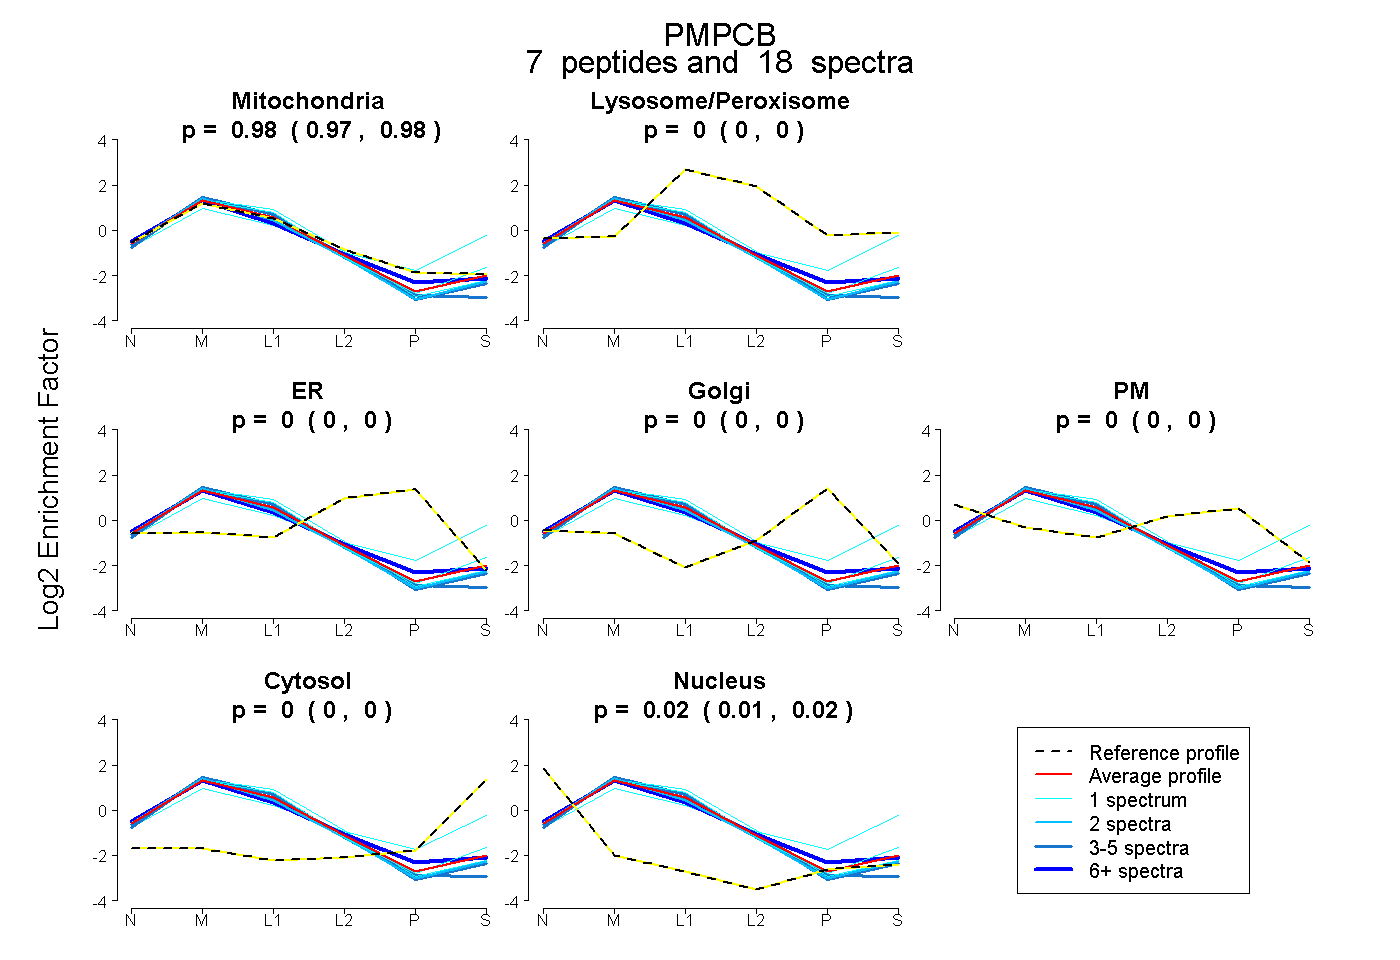
0.974 | 0.985
0.000 | 0.000
0.000 | 0.000
0.000 | 0.000
0.000 | 0.000
0.000 | 0.000
0.014 | 0.025