 13
13peptides
spectra
0.977 | 0.983
0.000 | 0.000
0.000 | 0.000
0.000 | 0.000
0.000 | 0.000
0.000 | 0.000
0.000 | 0.000
0.017 | 0.022
| Plot | Mito | Lyso | Perox | ER | Golgi | PM | Cytosol | Nucleus | |||||
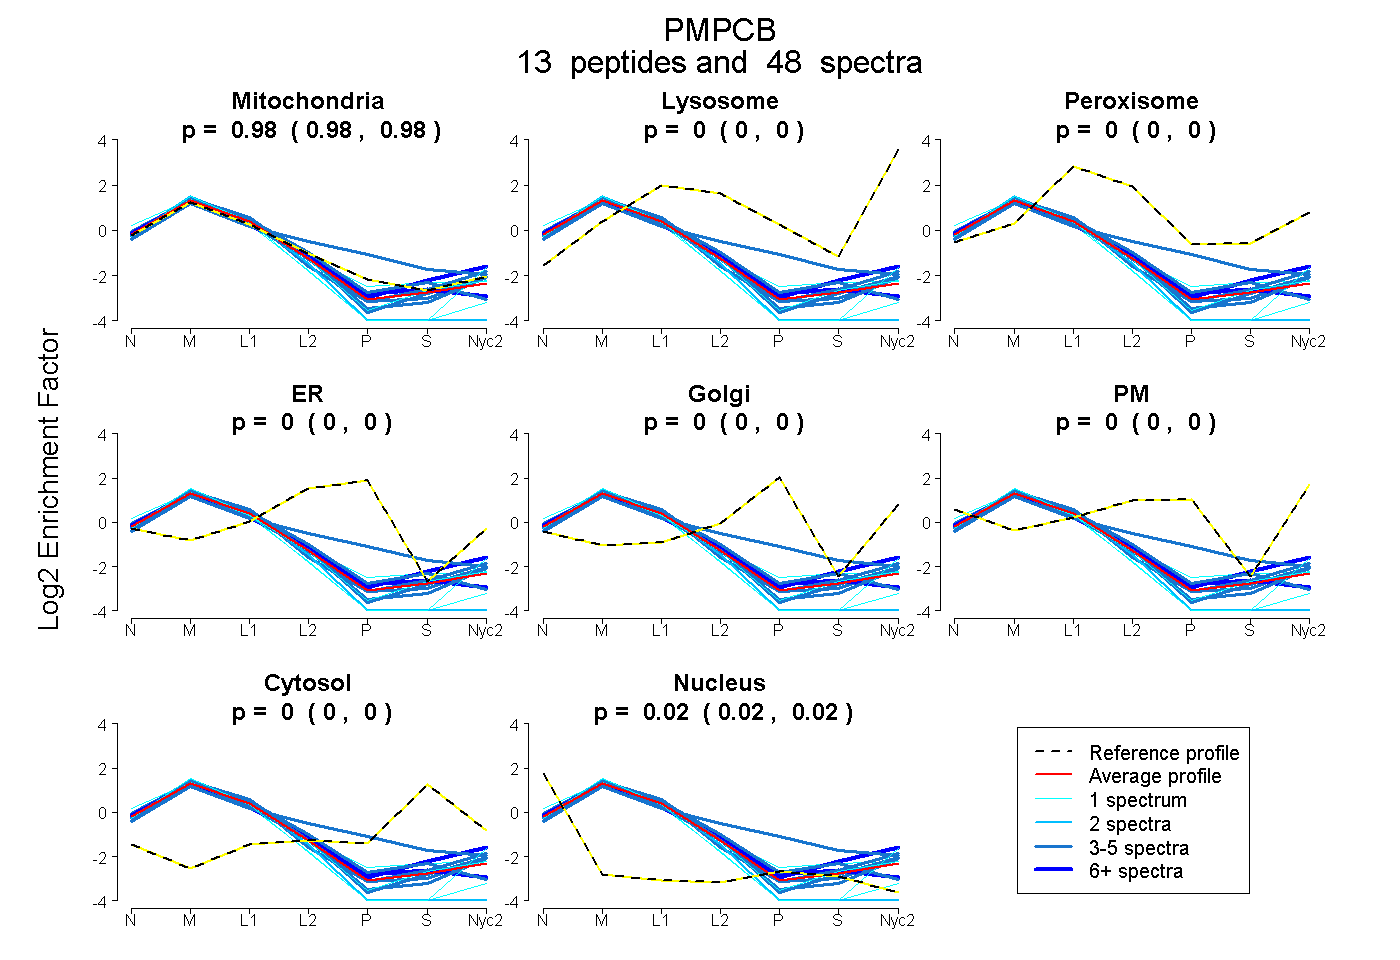
| Expt A |
13 peptides |
48 spectra |
|
0.980 0.977 | 0.983 |
0.000 0.000 | 0.000 |
0.000 0.000 | 0.000 |
0.000 0.000 | 0.000 |
0.000 0.000 | 0.000 |
0.000 0.000 | 0.000 |
0.000 0.000 | 0.000 |
0.020 0.017 | 0.022 |
| 1 spectrum, TNMLLQLDGSTPICEDIGR | 0.982 | 0.000 | 0.000 | 0.000 | 0.000 | 0.000 | 0.000 | 0.018 | ||
| 4 spectra, LPDFNQICSNMR | 0.982 | 0.000 | 0.000 | 0.000 | 0.000 | 0.000 | 0.000 | 0.018 | ||
| 4 spectra, QMLCYNR | 1.000 | 0.000 | 0.000 | 0.000 | 0.000 | 0.000 | 0.000 | 0.000 | ||
| 12 spectra, IDAVDAEMVR | 0.958 | 0.002 | 0.000 | 0.000 | 0.000 | 0.000 | 0.040 | 0.000 | ||
| 1 spectrum, TILGPTENIK | 0.975 | 0.000 | 0.000 | 0.000 | 0.000 | 0.000 | 0.000 | 0.025 | ||
| 2 spectra, IVLAAAGGVCHNELLELAK | 0.907 | 0.000 | 0.000 | 0.000 | 0.000 | 0.000 | 0.000 | 0.093 | ||
| 1 spectrum, GDVPALPPCK | 0.992 | 0.000 | 0.000 | 0.000 | 0.000 | 0.000 | 0.008 | 0.000 | ||
| 4 spectra, DLVDYITTHYK | 0.986 | 0.000 | 0.000 | 0.000 | 0.000 | 0.000 | 0.000 | 0.014 | ||
| 4 spectra, IPIPELEAR | 0.989 | 0.000 | 0.000 | 0.000 | 0.000 | 0.000 | 0.000 | 0.011 | ||
| 7 spectra, LCTAVSESEVAR | 0.949 | 0.000 | 0.000 | 0.000 | 0.000 | 0.000 | 0.000 | 0.051 | ||
| 1 spectrum, AVEILADIIQNSTLGEAEIER | 0.871 | 0.000 | 0.000 | 0.000 | 0.000 | 0.000 | 0.000 | 0.129 | ||
| 4 spectra, SFGGGMNLSSK | 0.977 | 0.000 | 0.000 | 0.000 | 0.000 | 0.000 | 0.000 | 0.023 | ||
| 3 spectra, NNGTAHFLEHMAFK | 0.740 | 0.000 | 0.055 | 0.130 | 0.000 | 0.000 | 0.074 | 0.000 |
| Plot | Mito | Lyso or Perox | ER | Golgi | PM | Cytosol | Nucleus | ||||||
| Expt B |
7 peptides |
18 spectra |
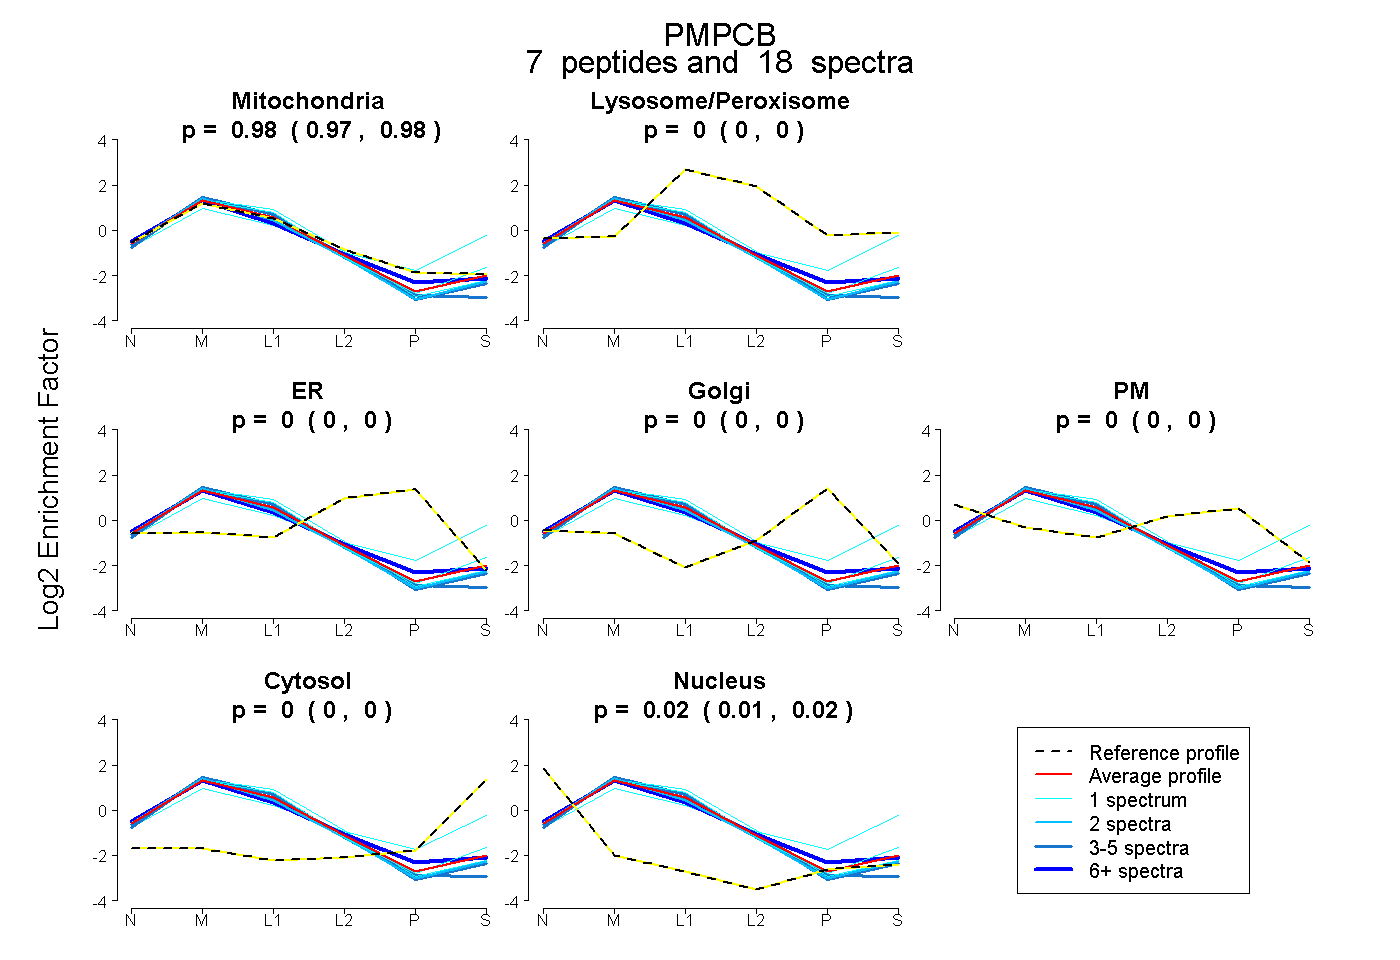 |
0.980 0.974 | 0.985 |
0.000 0.000 | 0.000 |
0.000 0.000 | 0.000 |
0.000 0.000 | 0.000 |
0.000 0.000 | 0.000 |
0.000 0.000 | 0.000 |
0.020 0.014 | 0.025 |
|||
| Plot | Lyso | Other | |||||||||||
| Expt C |
13 peptides |
138 spectra |
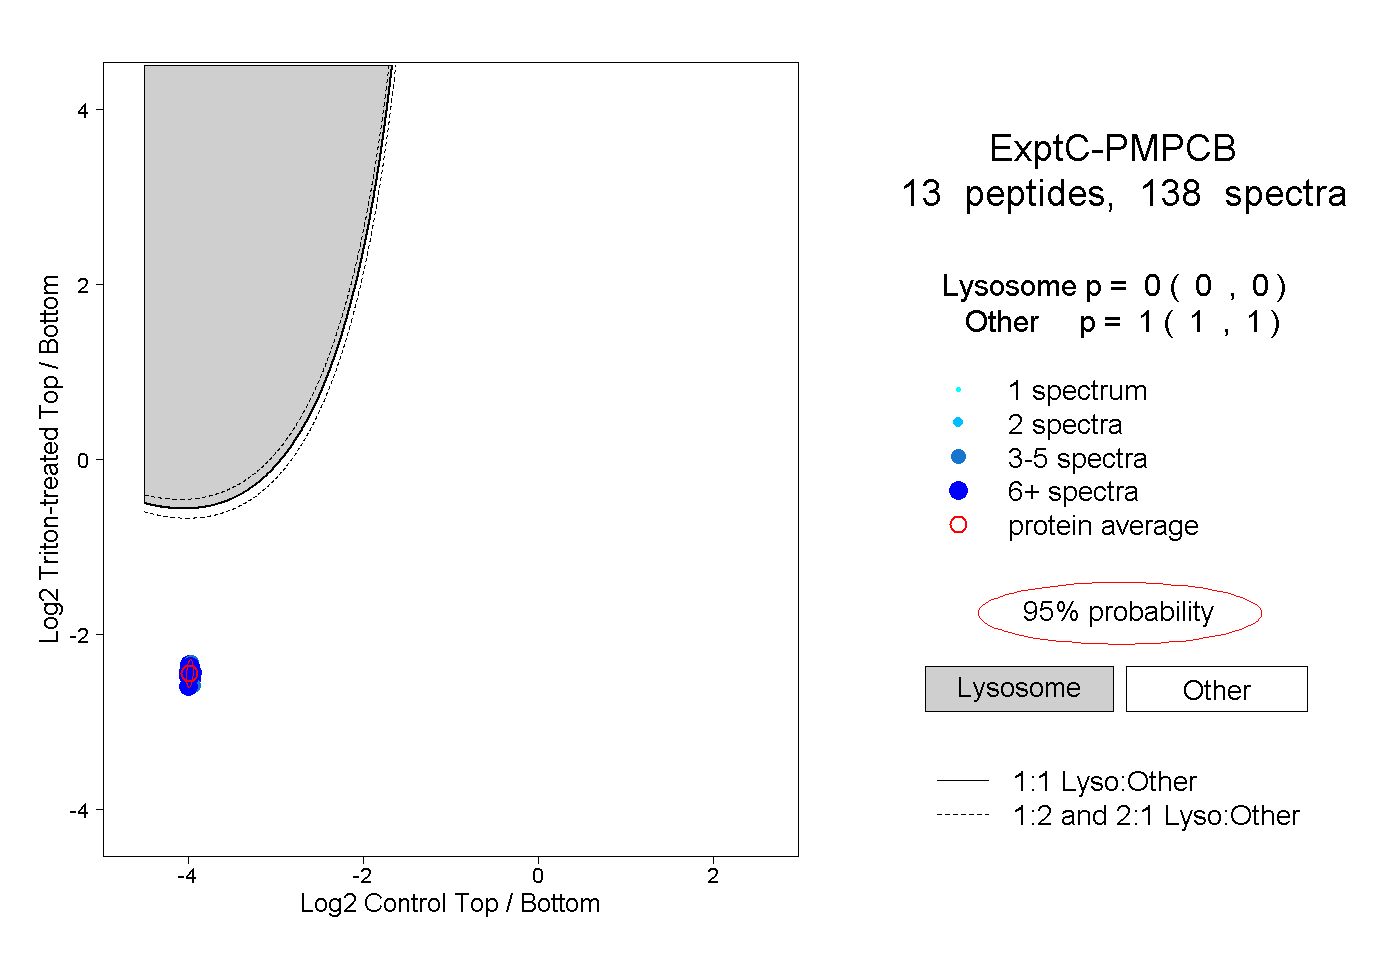 |
0.000 0.000 | 0.000 |
1.000 1.000 | 1.000 |
||||||||
| Plot | Lyso | Other | |||||||||||
| Expt D |
3 peptides |
9 spectra |
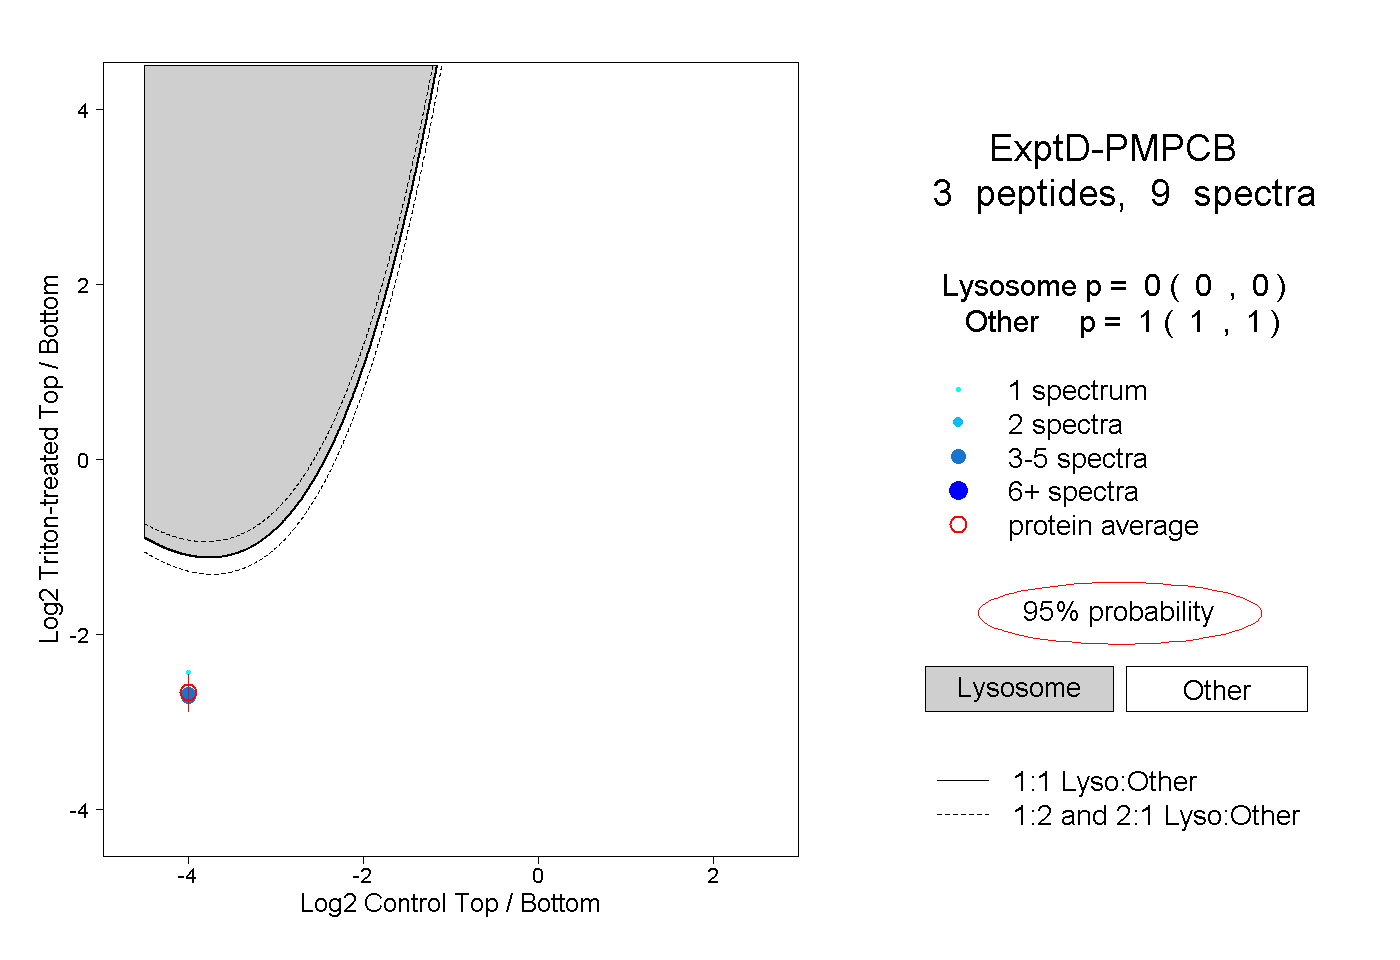 |
0.000 0.000 | 0.000 |
1.000 1.000 | 1.000 |