 2
2peptides
spectra
0.000 | 0.000
0.173 | 0.546
0.000 | 0.179
0.000 | 0.000
0.000 | 0.000
0.037 | 0.328
0.283 | 0.417
0.000 | 0.053
2peptides
spectra
1.000 | 1.000
0.000 | 0.000
| Plot | Mito | Lyso | Perox | ER | Golgi | PM | Cytosol | Nucleus | |||||
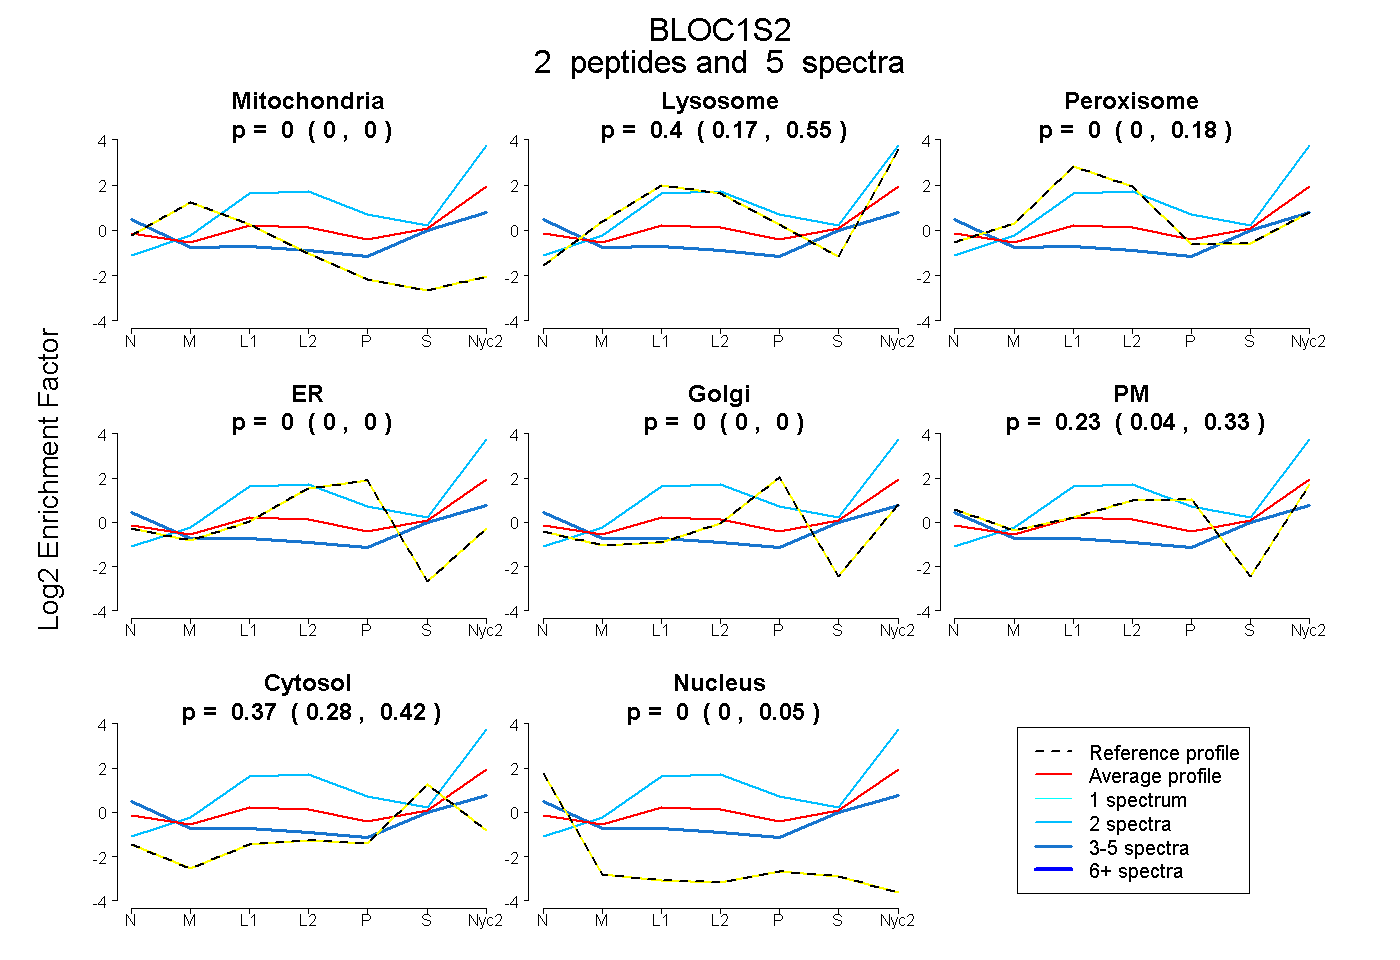
| Expt A |
2 peptides |
5 spectra |
|
0.000 0.000 | 0.000 |
0.400 0.173 | 0.546 |
0.000 0.000 | 0.179 |
0.000 0.000 | 0.000 |
0.000 0.000 | 0.000 |
0.226 0.037 | 0.328 |
0.374 0.283 | 0.417 |
0.000 0.000 | 0.053 |
||
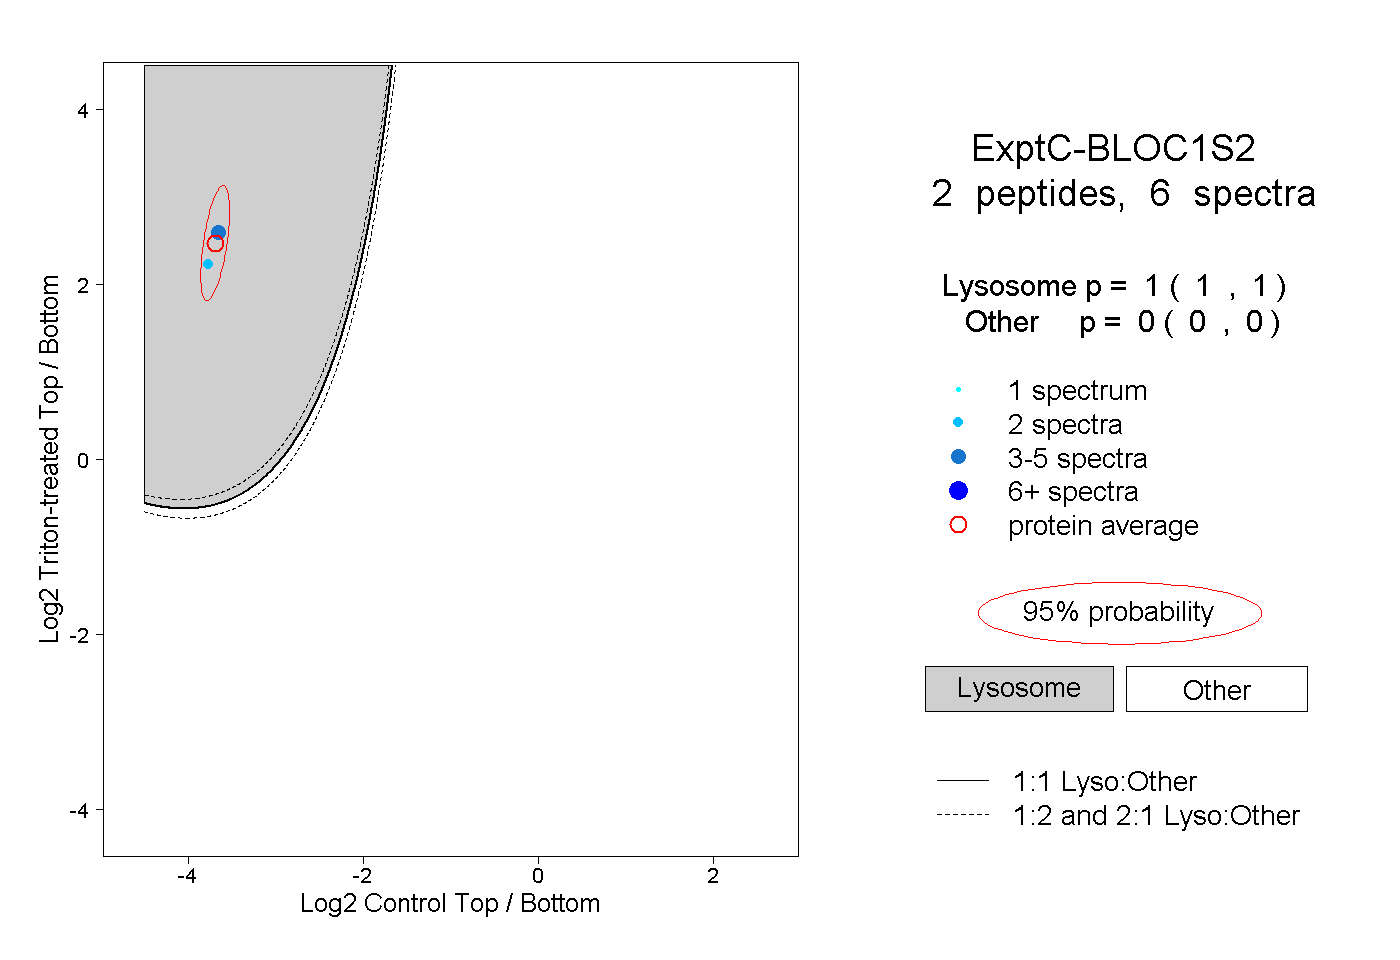
| Plot | Lyso | Other | |||||||||||
| Expt C |
2 peptides |
6 spectra |
|
1.000 1.000 | 1.000 |
0.000 0.000 | 0.000 |