 4
4peptides
spectra
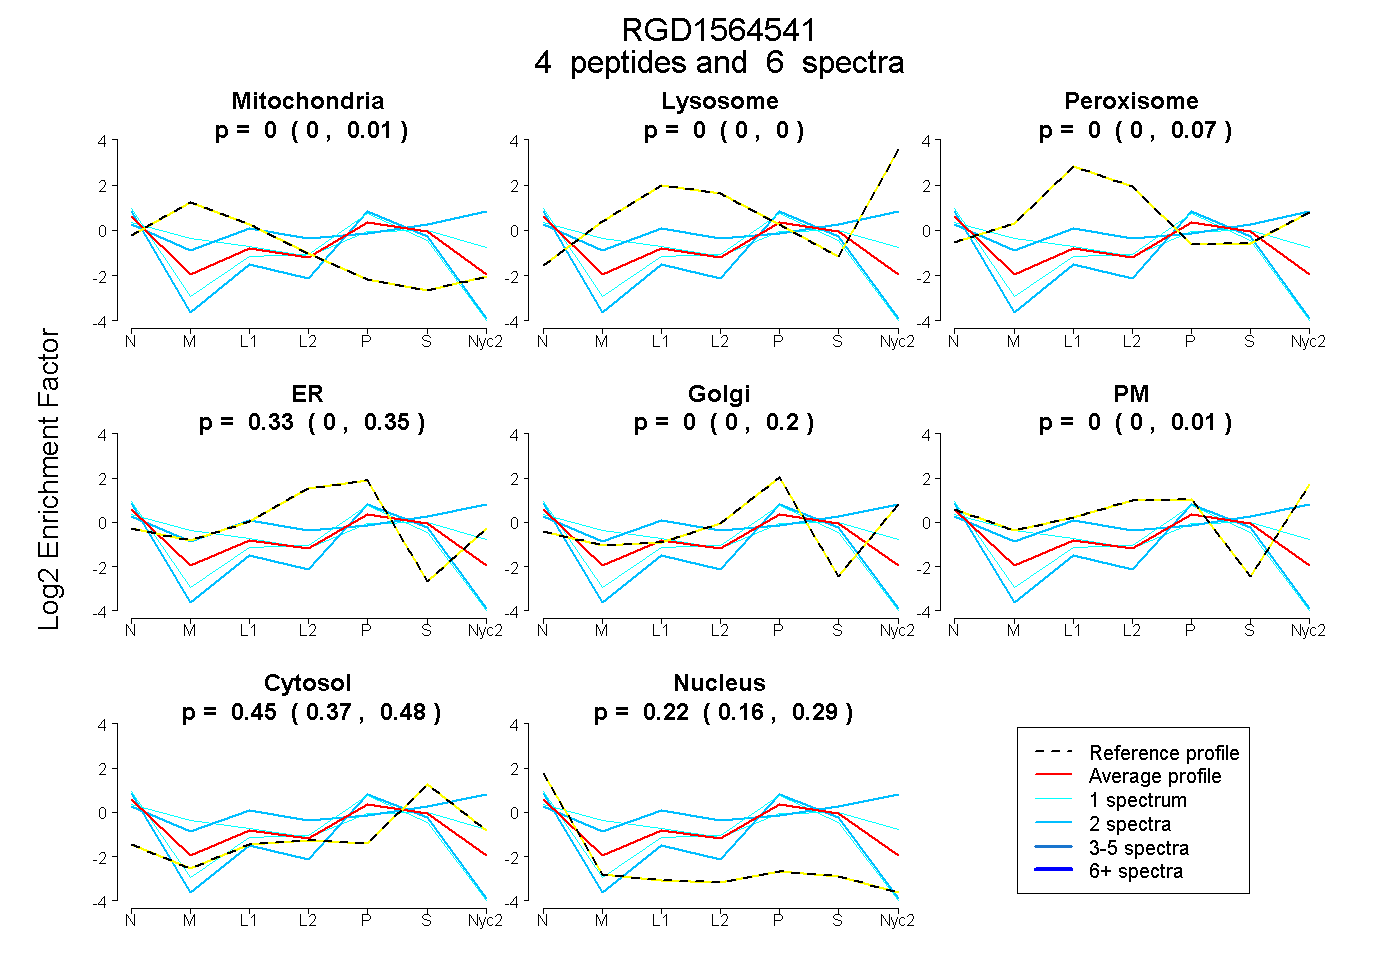
0.000 | 0.007
0.000 | 0.000
0.000 | 0.074
0.002 | 0.350
0.000 | 0.196
0.000 | 0.014
0.374 | 0.479
0.158 | 0.286
1peptide
spectrum
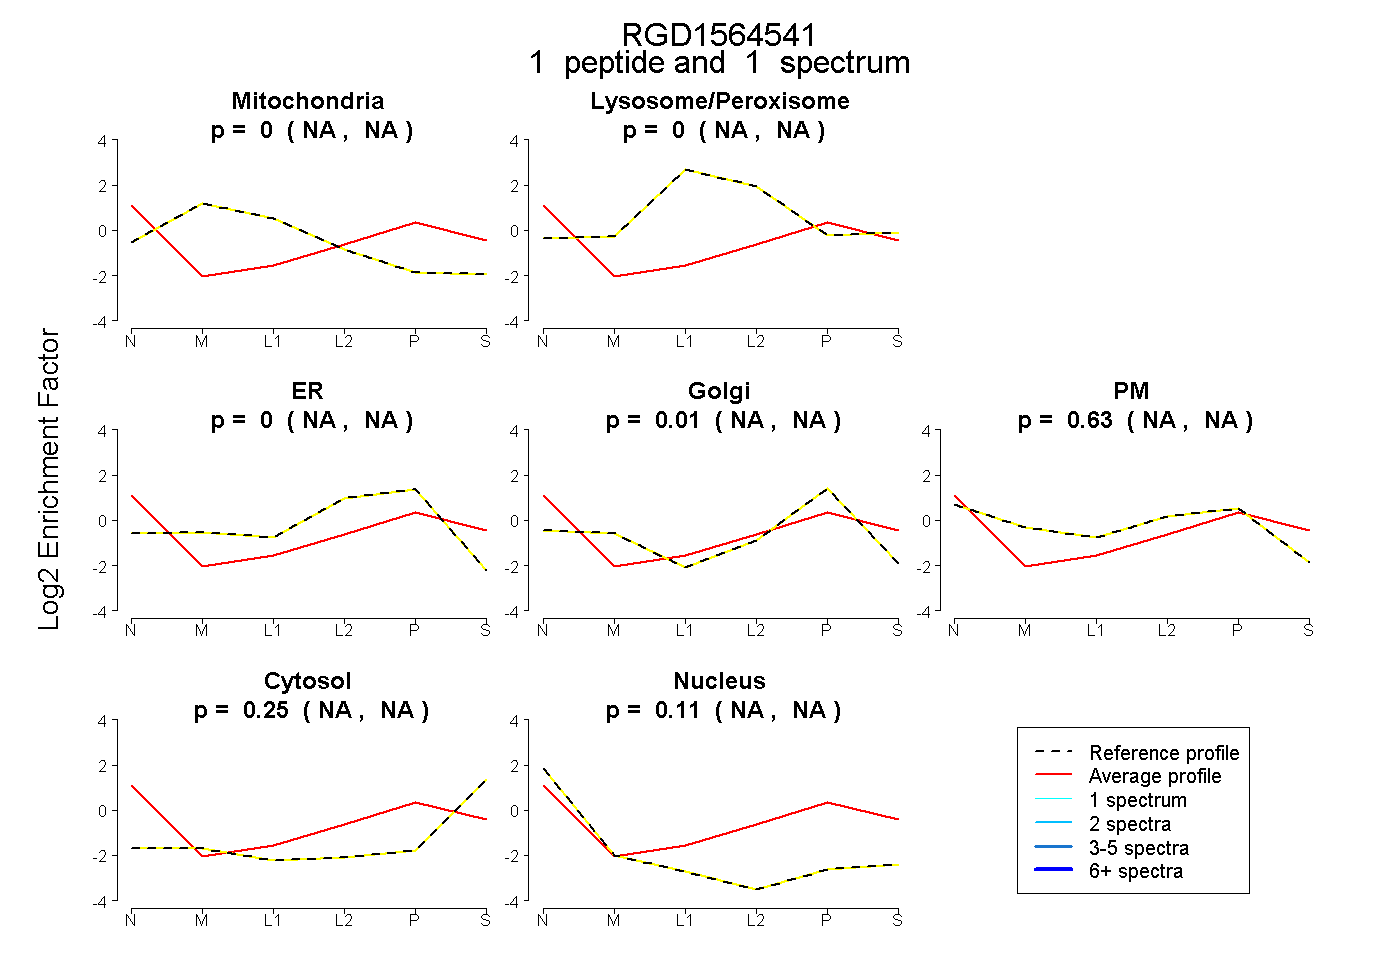
NA | NA
NA | NA
NA | NA
NA | NA
NA | NA
NA | NA
NA | NA
1peptide
spectra
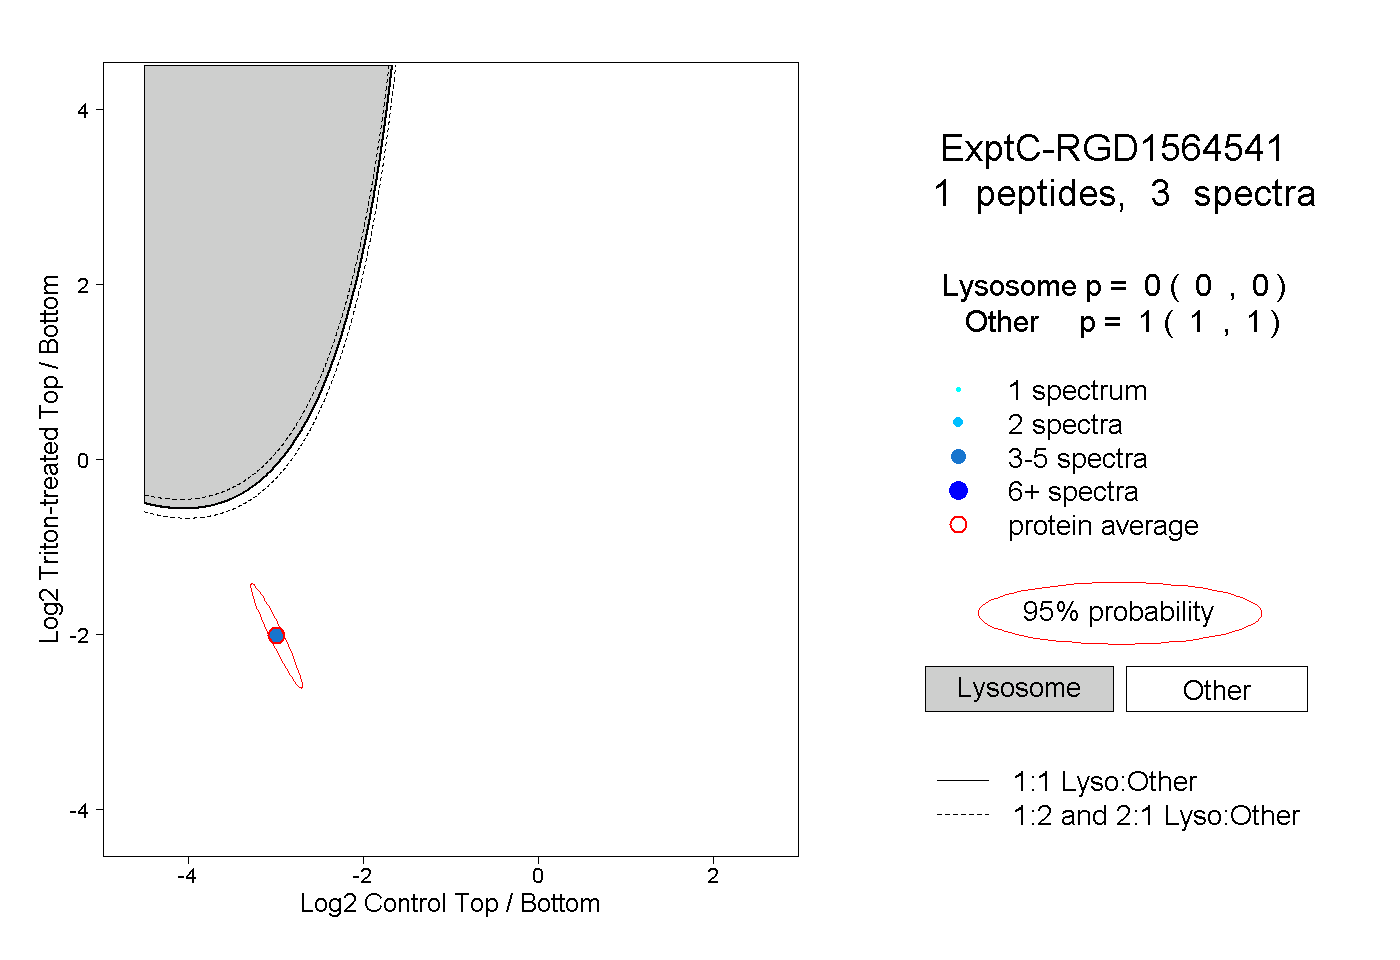
0.000 | 0.000
1.000 | 1.000