 3
3peptides
spectra
0.408 | 0.496
0.134 | 0.217
0.093 | 0.301
0.000 | 0.051
0.000 | 0.000
0.081 | 0.179
0.000 | 0.000
0.000 | 0.000
8peptides
spectra
0.000 | 0.002
0.998 | 1.000
| Plot | Mito | Lyso | Perox | ER | Golgi | PM | Cytosol | Nucleus | |||||
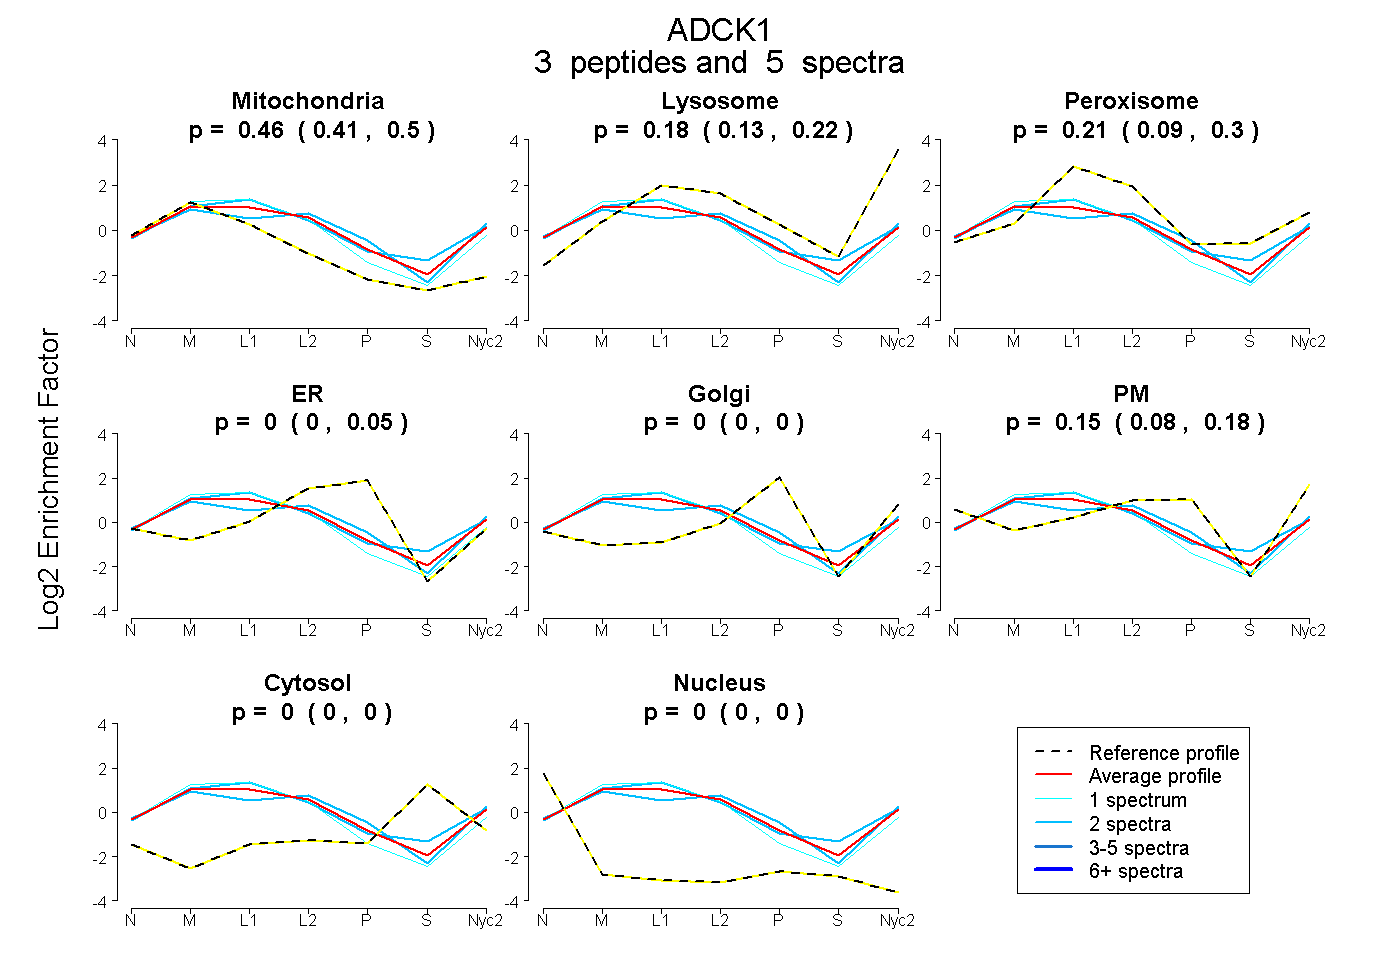
| Expt A |
3 peptides |
5 spectra |
|
0.458 0.408 | 0.496 |
0.176 0.134 | 0.217 |
0.212 0.093 | 0.301 |
0.000 0.000 | 0.051 |
0.000 0.000 | 0.000 |
0.154 0.081 | 0.179 |
0.000 0.000 | 0.000 |
0.000 0.000 | 0.000 |
||
| Plot | Lyso | Other | |||||||||||
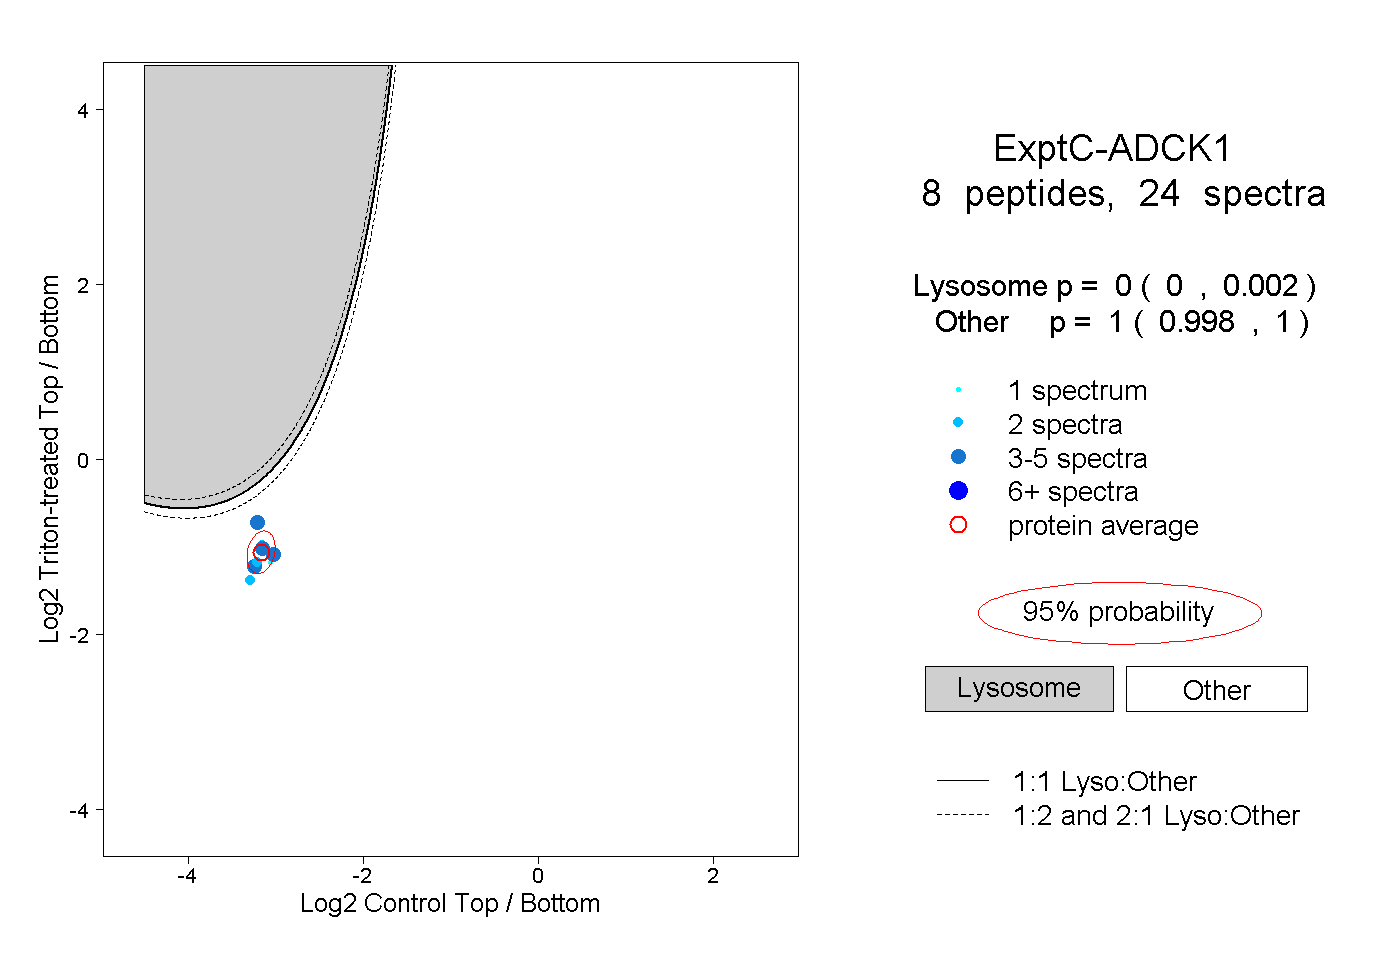
| Expt C |
8 peptides |
24 spectra |
|
0.000 0.000 | 0.002 |
1.000 0.998 | 1.000 |
| 2 spectra, DAGSFFR | 0.000 | 1.000 | ||||||||
| 4 spectra, HFDFLK | 0.000 | 1.000 | ||||||||
| 5 spectra, VQAQSSK | 0.000 | 1.000 | ||||||||
| 2 spectra, SIETTLGTR | 0.000 | 1.000 | ||||||||
| 1 spectrum, AVLHDGR | 0.000 | 1.000 | ||||||||
| 2 spectra, VPQIHWELSTK | 0.000 | 1.000 | ||||||||
| 4 spectra, AIAEHR | 0.000 | 1.000 | ||||||||
| 4 spectra, SVPYGSEEYLQR | 0.010 | 0.990 |