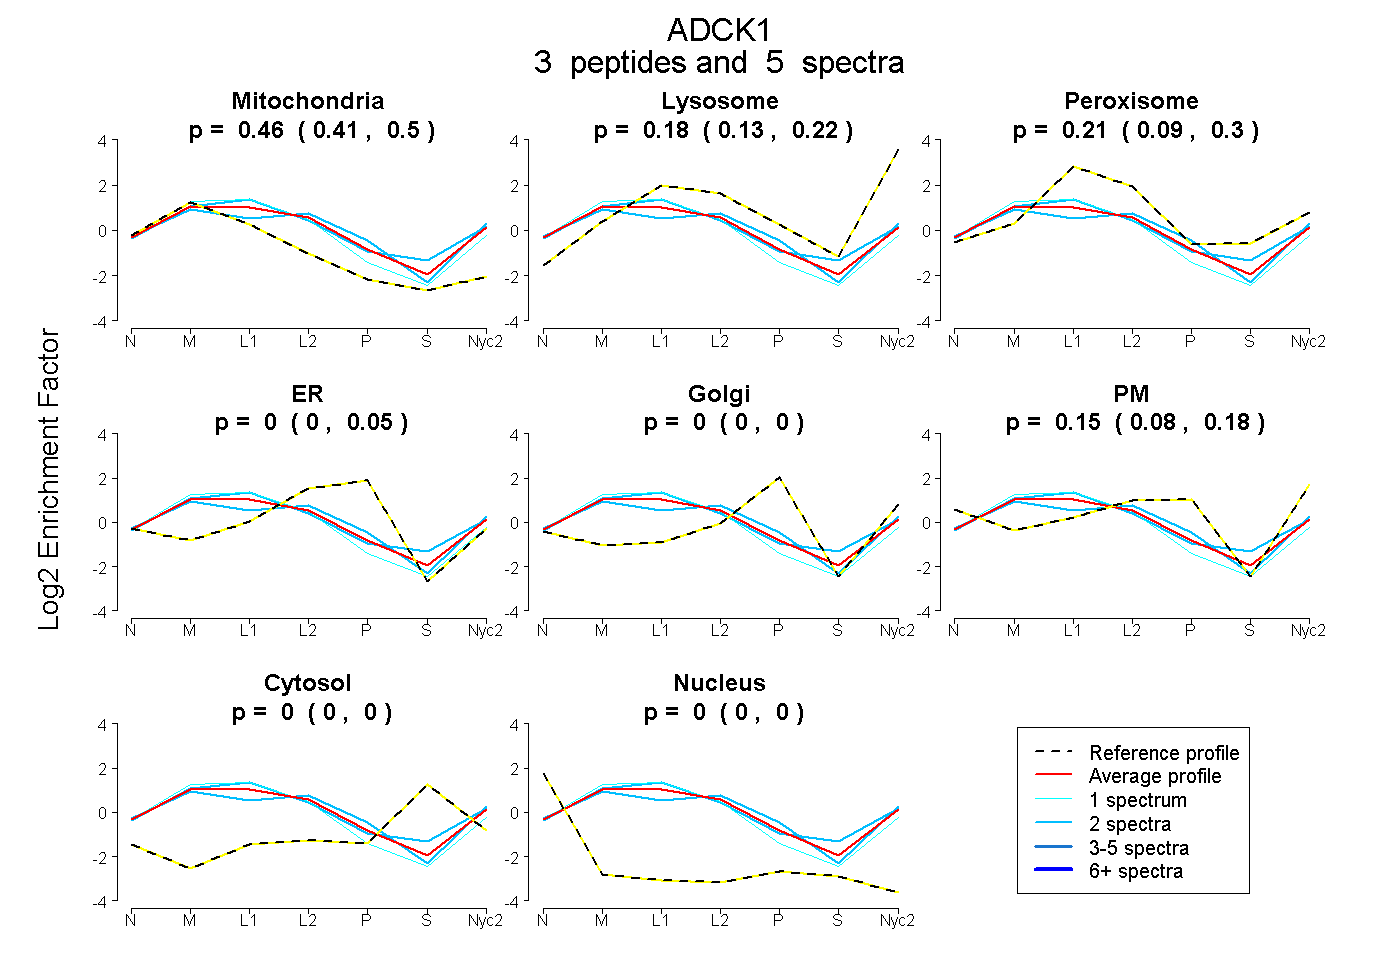
 3
3peptides
spectra
0.408 | 0.496
0.134 | 0.217
0.093 | 0.301
0.000 | 0.051
0.000 | 0.000
0.081 | 0.179
0.000 | 0.000
0.000 | 0.000
| Plot | Mito | Lyso | Perox | ER | Golgi | PM | Cytosol | Nucleus | |||||
| Expt A |
3 peptides |
5 spectra |
|
0.458 0.408 | 0.496 |
0.176 0.134 | 0.217 |
0.212 0.093 | 0.301 |
0.000 0.000 | 0.051 |
0.000 0.000 | 0.000 |
0.154 0.081 | 0.179 |
0.000 0.000 | 0.000 |
0.000 0.000 | 0.000 |
| 2 spectra, NLPLELDFLNEGR | 0.419 | 0.217 | 0.037 | 0.105 | 0.000 | 0.222 | 0.000 | 0.000 | ||
| 2 spectra, SSASSFLNMSR | 0.437 | 0.192 | 0.335 | 0.000 | 0.000 | 0.031 | 0.004 | 0.000 | ||
| 1 spectrum, VLLMEFVEGGQVNDR | 0.569 | 0.171 | 0.234 | 0.000 | 0.000 | 0.027 | 0.000 | 0.000 |
| Plot | Lyso | Other | |||||||||||
| Expt C |
8 peptides |
24 spectra |
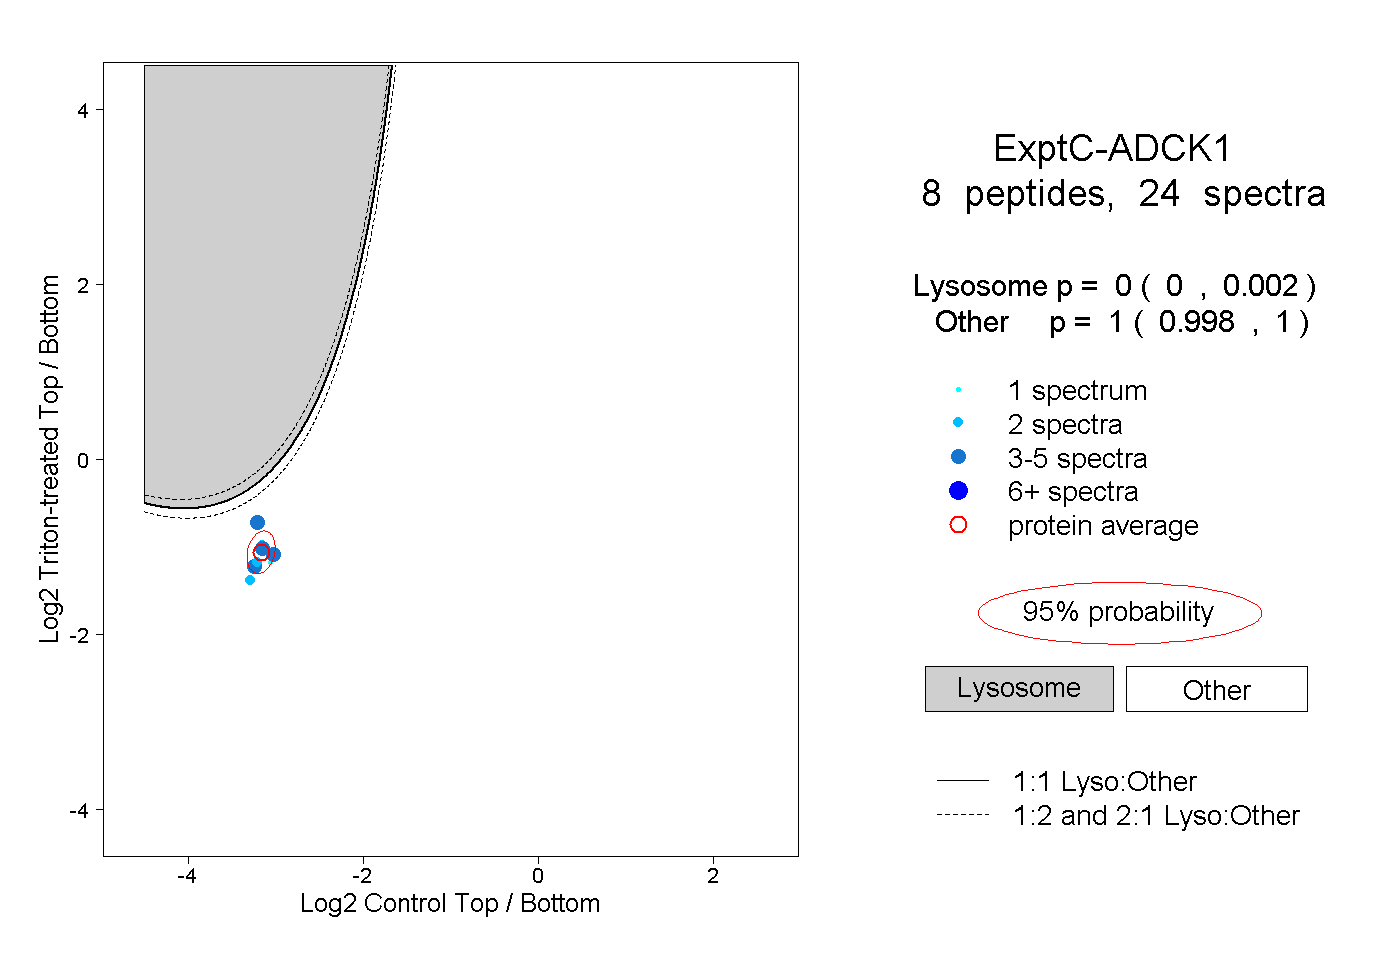 |
0.000 0.000 | 0.002 |
1.000 0.998 | 1.000 |