 4
4peptides
spectra
0.000 | 0.000
0.028 | 0.120
0.000 | 0.030
0.000 | 0.000
0.271 | 0.503
0.232 | 0.433
0.096 | 0.231
0.000 | 0.000
| Plot | Mito | Lyso | Perox | ER | Golgi | PM | Cytosol | Nucleus | |||||
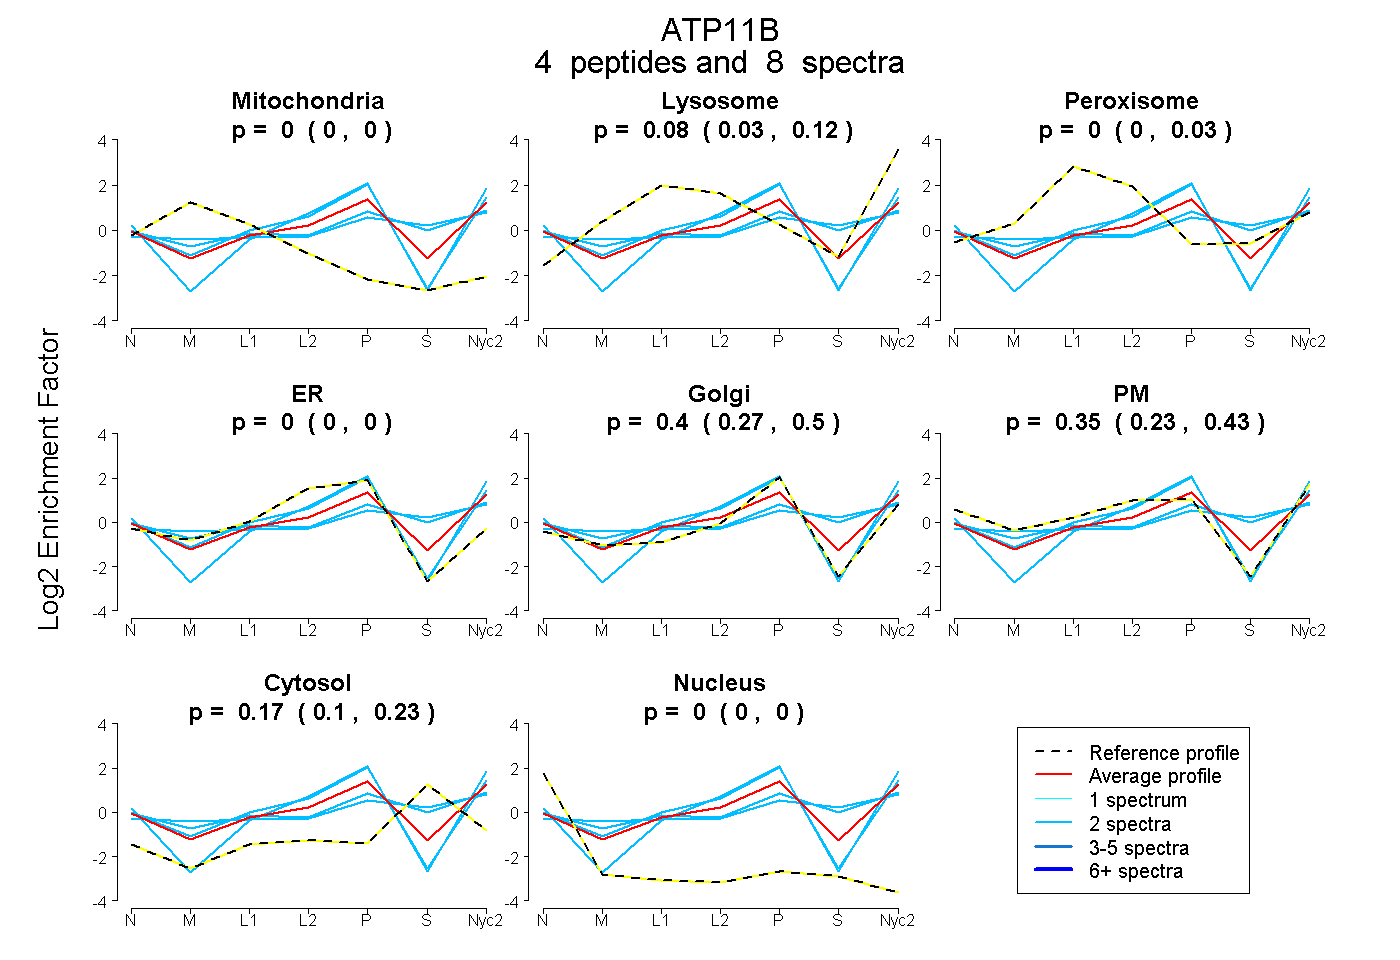
| Expt A |
4 peptides |
8 spectra |
|
0.000 0.000 | 0.000 |
0.080 0.028 | 0.120 |
0.000 0.000 | 0.030 |
0.000 0.000 | 0.000 |
0.396 0.271 | 0.503 |
0.351 0.232 | 0.433 |
0.173 0.096 | 0.231 |
0.000 0.000 | 0.000 |
| 2 spectra, LLHILEFDSDR | 0.000 | 0.000 | 0.000 | 0.000 | 0.683 | 0.317 | 0.000 | 0.000 | ||
| 2 spectra, AQLAEAPSGVK | 0.000 | 0.087 | 0.074 | 0.000 | 0.178 | 0.307 | 0.354 | 0.000 | ||
| 2 spectra, SDSGCAEQLR | 0.000 | 0.044 | 0.000 | 0.076 | 0.502 | 0.378 | 0.000 | 0.000 | ||
| 2 spectra, VGDIVR | 0.000 | 0.135 | 0.077 | 0.000 | 0.162 | 0.226 | 0.400 | 0.000 |
| Plot | Mito | Lyso or Perox | ER | Golgi | PM | Cytosol | Nucleus | ||||||
| Expt B |
1 peptide |
1 spectrum |
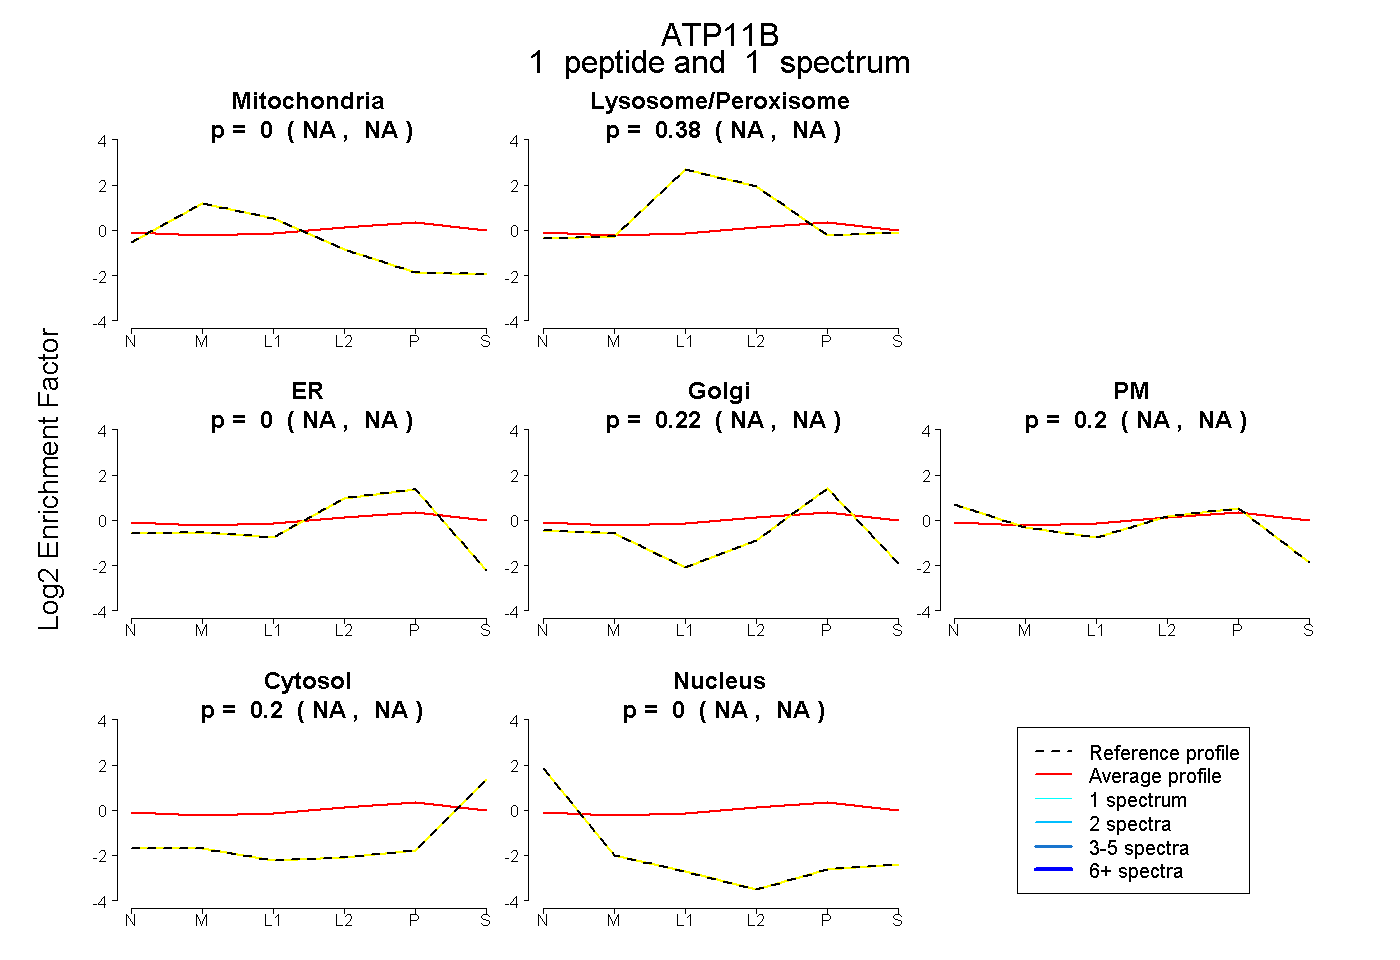 |
0.000 NA | NA |
0.379 NA | NA |
0.000 NA | NA |
0.224 NA | NA |
0.199 NA | NA |
0.198 NA | NA |
0.000 NA | NA |
|||
| Plot | Lyso | Other | |||||||||||
| Expt C |
4 peptides |
10 spectra |
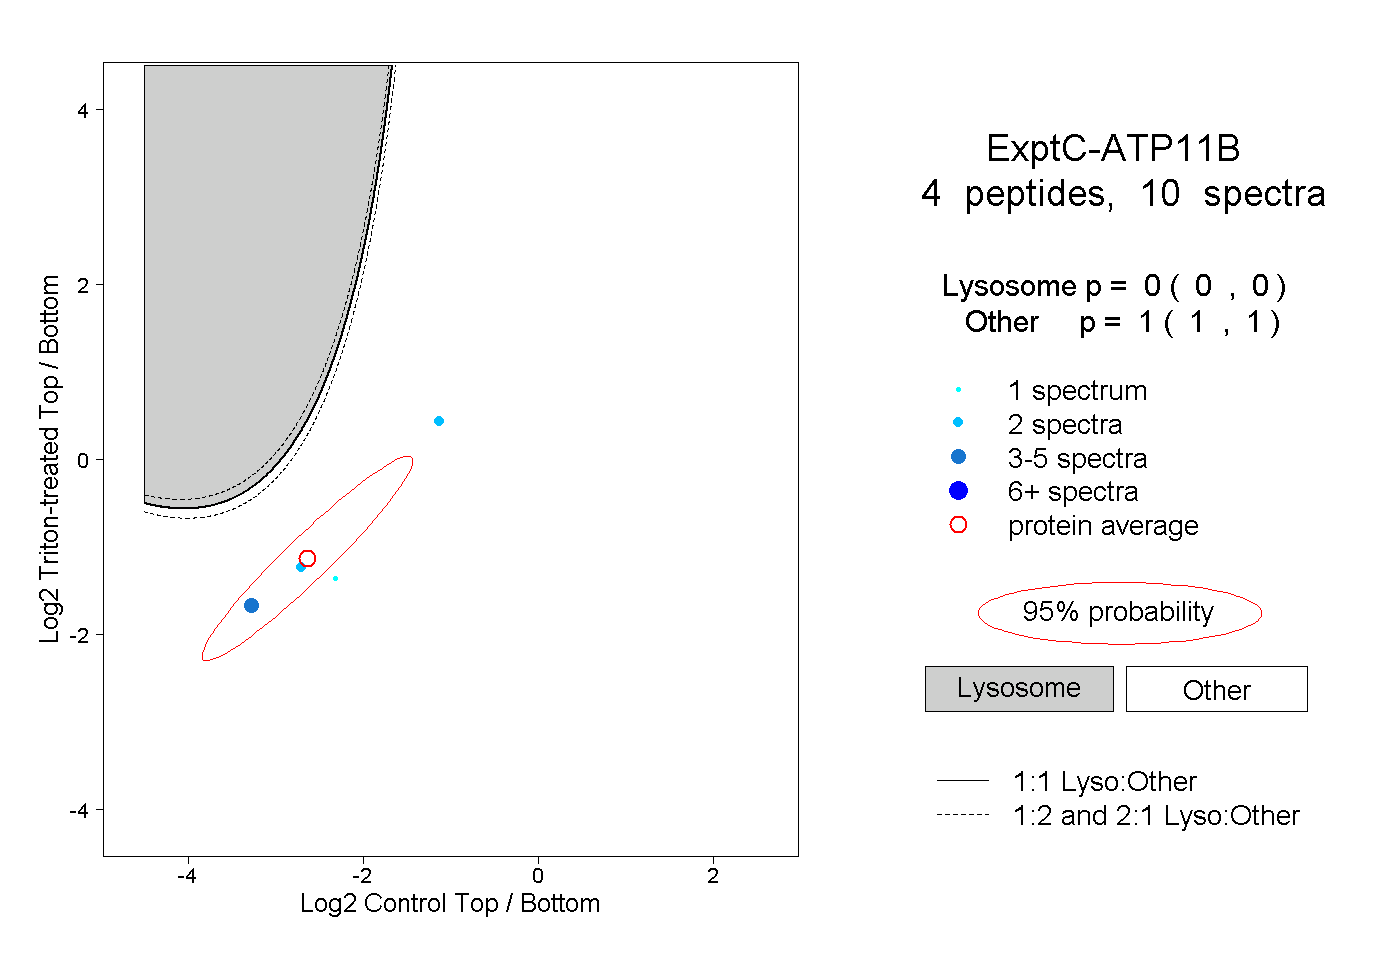 |
0.000 0.000 | 0.000 |
1.000 1.000 | 1.000 |