 4
4peptides
spectra
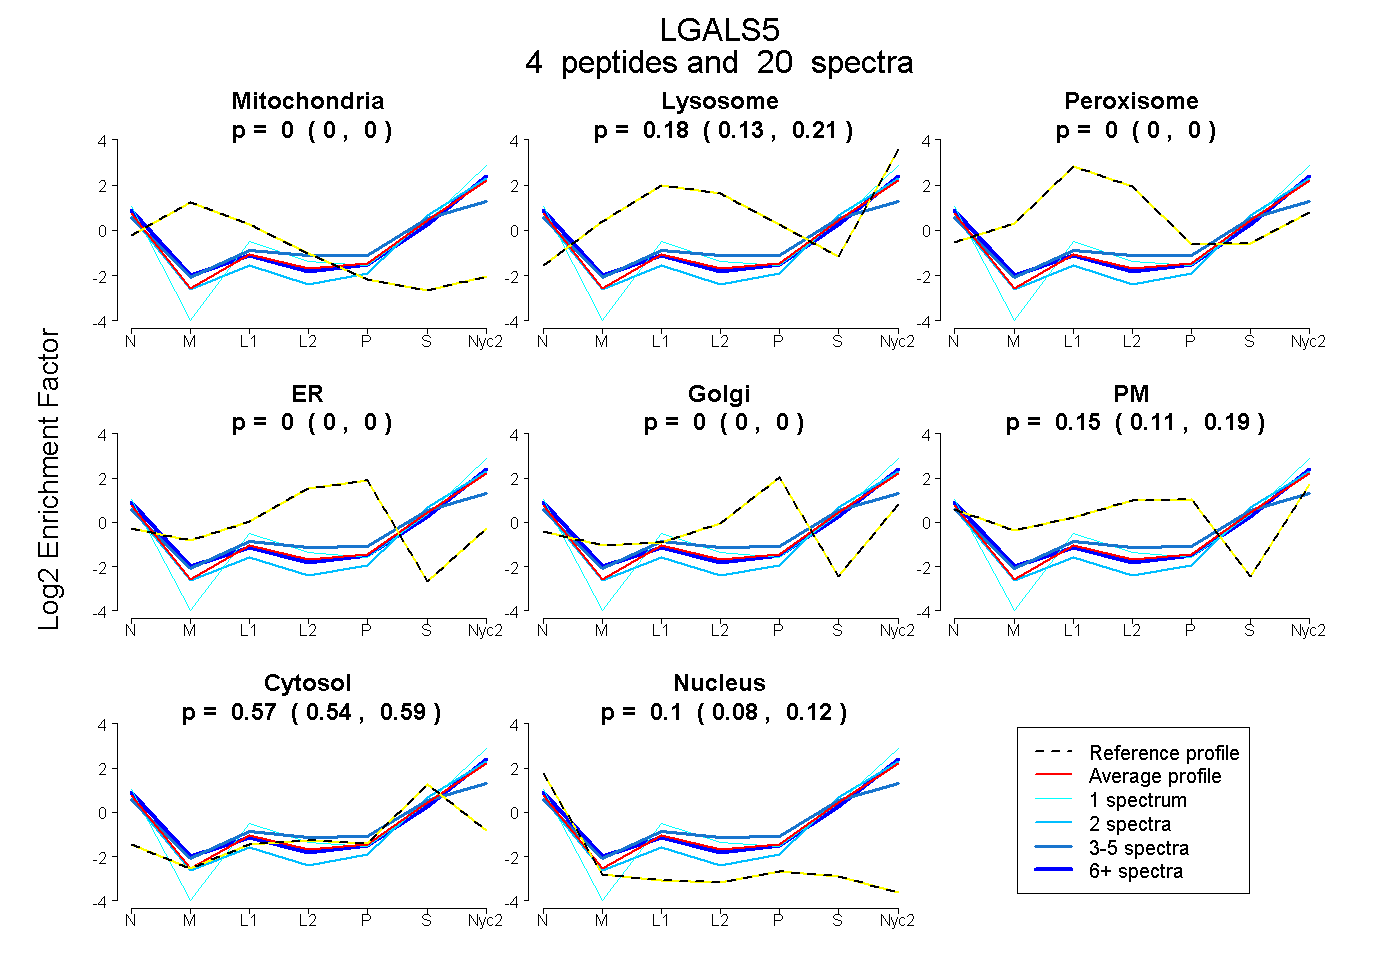
0.000 | 0.000
0.135 | 0.214
0.000 | 0.000
0.000 | 0.000
0.000 | 0.000
0.113 | 0.191
0.542 | 0.586
0.079 | 0.121
2peptides
spectra
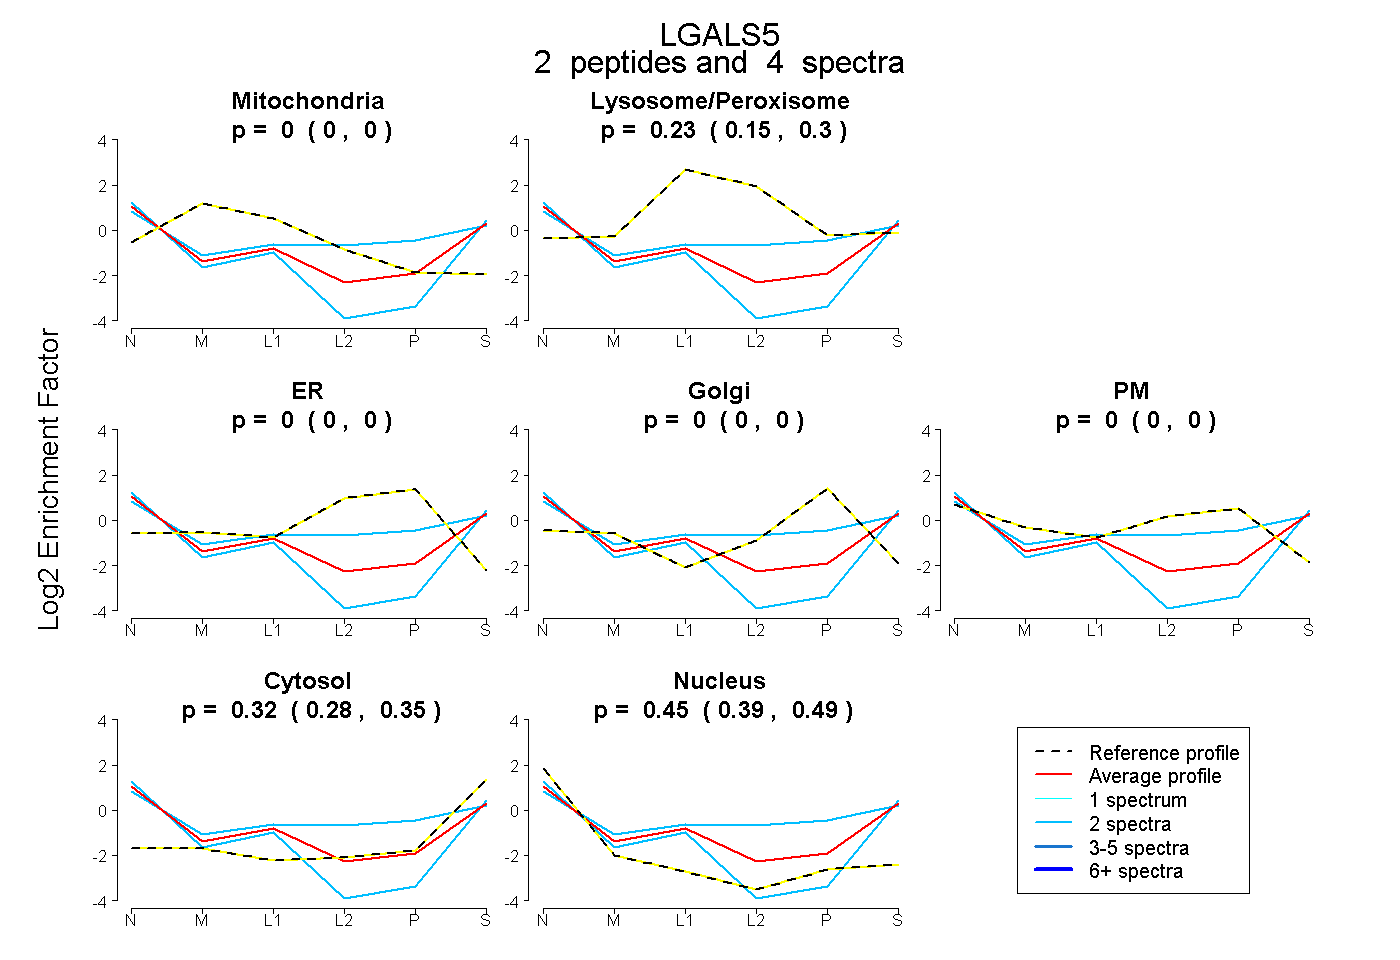
0.000 | 0.000
0.154 | 0.302
0.000 | 0.000
0.000 | 0.000
0.000 | 0.000
0.280 | 0.350
0.392 | 0.492
3peptides
spectra
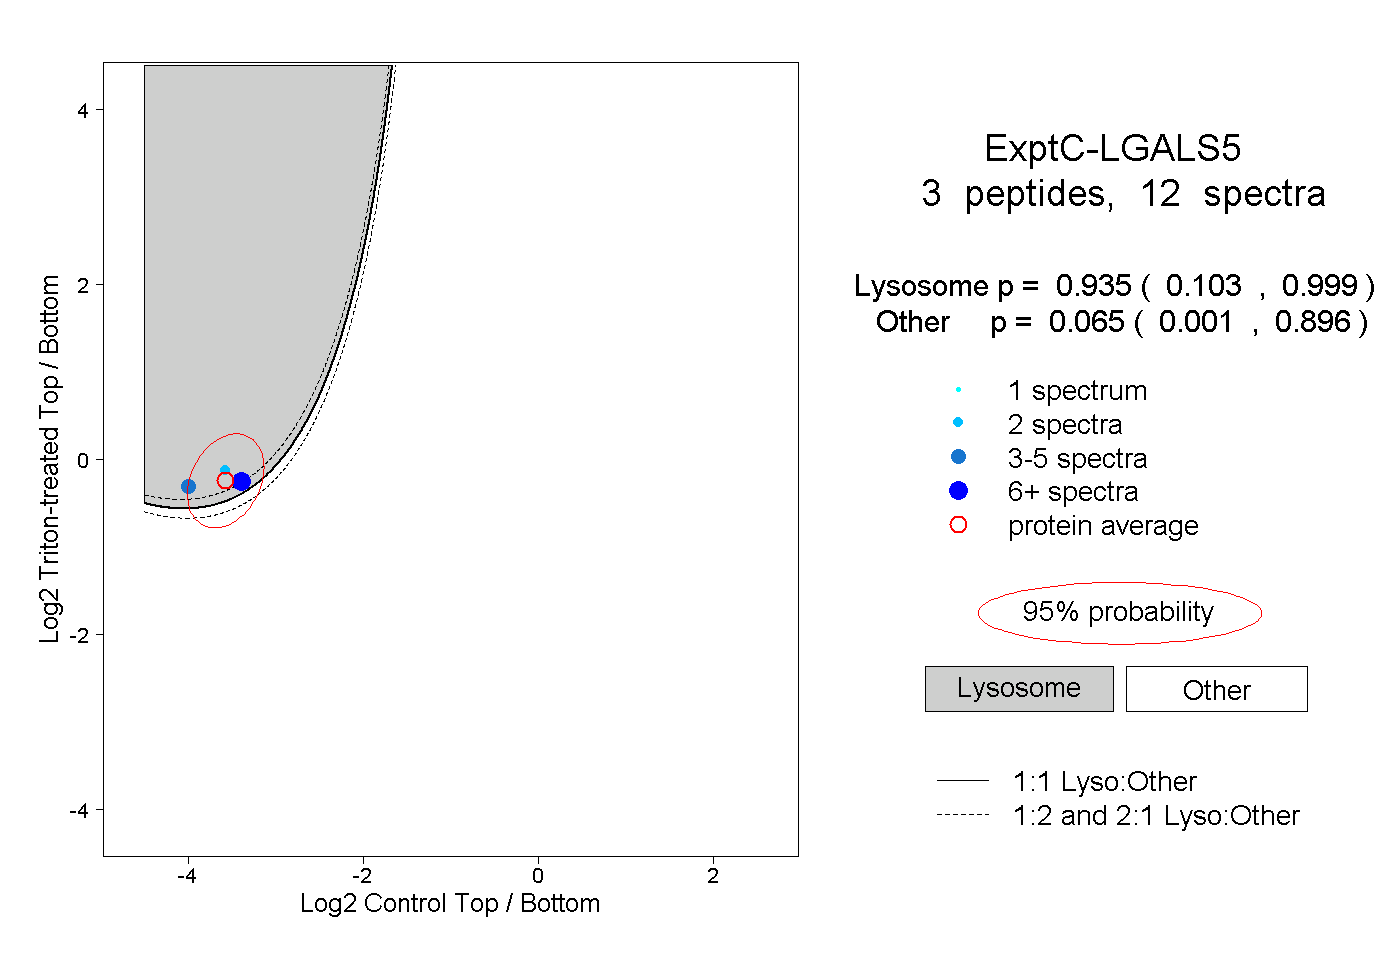
0.103 | 0.999
0.001 | 0.896