 4
4peptides
spectra
0.000 | 0.000
0.039 | 0.079
0.000 | 0.054
0.000 | 0.097
0.000 | 0.138
0.068 | 0.160
0.673 | 0.714
0.000 | 0.000
2peptides
spectra
0.000 | 0.000
1.000 | 1.000
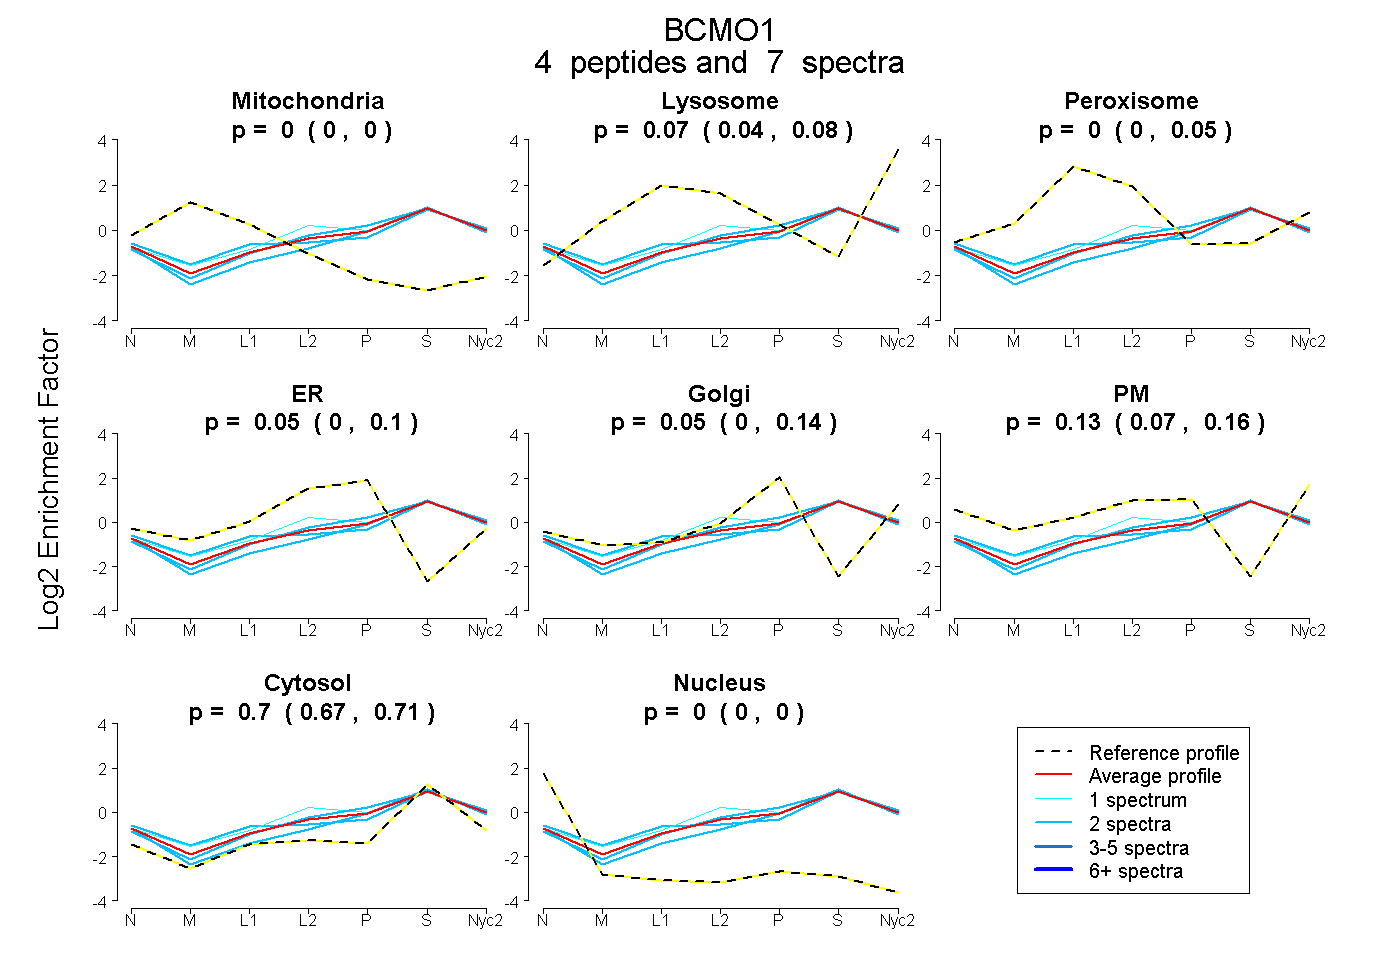
| Plot | Mito | Lyso | Perox | ER | Golgi | PM | Cytosol | Nucleus | |||||
| Expt A |
4 peptides |
7 spectra |
|
0.000 0.000 | 0.000 |
0.067 0.039 | 0.079 |
0.000 0.000 | 0.054 |
0.053 0.000 | 0.097 |
0.050 0.000 | 0.138 |
0.128 0.068 | 0.160 |
0.703 0.673 | 0.714 |
0.000 0.000 | 0.000 |
||
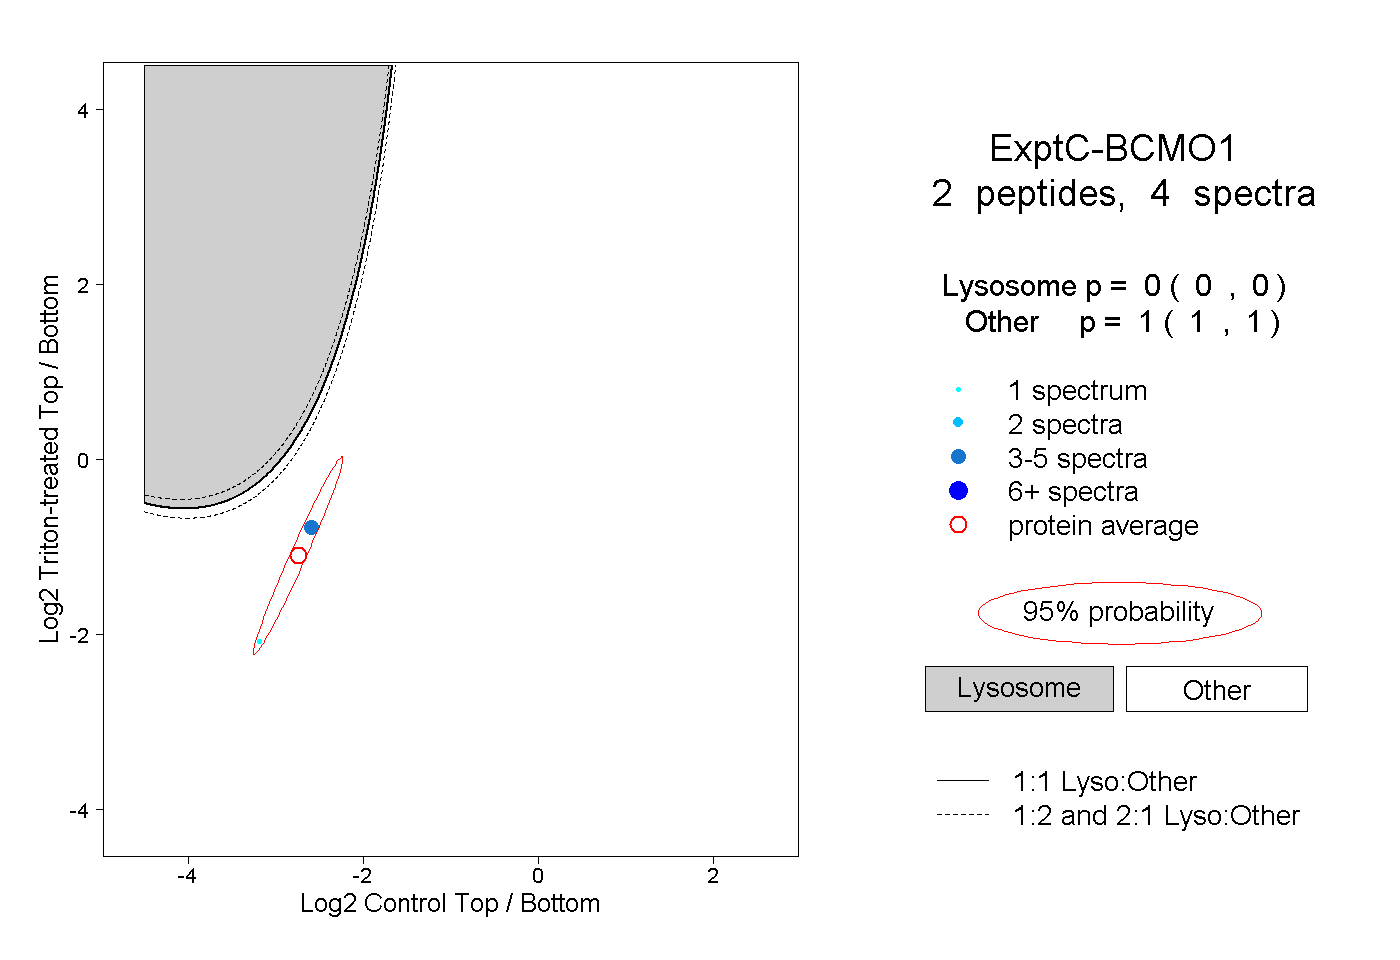
| Plot | Lyso | Other | |||||||||||
| Expt C |
2 peptides |
4 spectra |
|
0.000 0.000 | 0.000 |
1.000 1.000 | 1.000 |
| 3 spectra, IPATAPGSK | 0.000 | 1.000 | ||||||||
| 1 spectrum, KPVPTK | 0.000 | 1.000 |