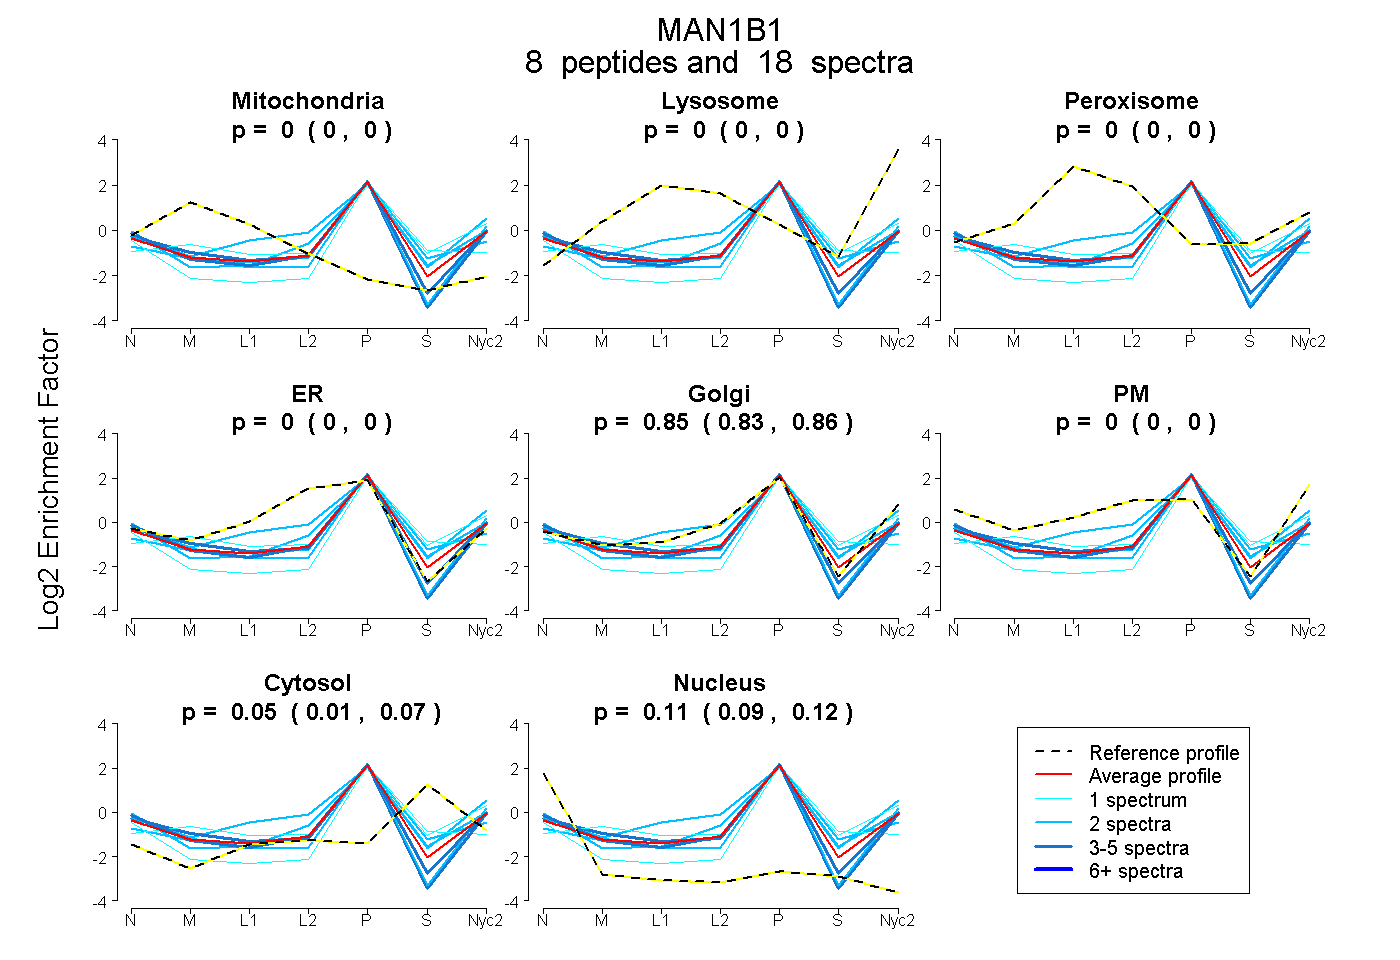
 8
8peptides
spectra
0.000 | 0.000
0.000 | 0.000
0.000 | 0.000
0.000 | 0.000
0.831 | 0.865
0.000 | 0.000
0.013 | 0.071
0.090 | 0.120
| Plot | Mito | Lyso | Perox | ER | Golgi | PM | Cytosol | Nucleus | |||||
| Expt A |
8 peptides |
18 spectra |
|
0.000 0.000 | 0.000 |
0.000 0.000 | 0.000 |
0.000 0.000 | 0.000 |
0.000 0.000 | 0.000 |
0.849 0.831 | 0.865 |
0.000 0.000 | 0.000 |
0.045 0.013 | 0.071 |
0.106 0.090 | 0.120 |
| 2 spectra, FQEAVEEVTK | 0.000 | 0.000 | 0.000 | 0.000 | 0.852 | 0.000 | 0.000 | 0.148 | ||
| 1 spectrum, GPPHLQIRPPNTVSK | 0.000 | 0.000 | 0.000 | 0.000 | 0.778 | 0.000 | 0.222 | 0.000 | ||
| 1 spectrum, ESAEPEGFADILSQK | 0.000 | 0.000 | 0.000 | 0.000 | 0.561 | 0.000 | 0.264 | 0.175 | ||
| 2 spectra, ADSYYEYLLK | 0.000 | 0.000 | 0.000 | 0.000 | 0.731 | 0.000 | 0.218 | 0.051 | ||
| 2 spectra, DVEVKPADR | 0.000 | 0.000 | 0.000 | 0.000 | 0.800 | 0.000 | 0.125 | 0.075 | ||
| 2 spectra, AEDFGNR | 0.000 | 0.000 | 0.067 | 0.026 | 0.828 | 0.000 | 0.079 | 0.000 | ||
| 5 spectra, ETQLLEDYVR | 0.000 | 0.000 | 0.000 | 0.000 | 0.869 | 0.000 | 0.000 | 0.131 | ||
| 3 spectra, NVDVNLFESTIR | 0.000 | 0.000 | 0.000 | 0.000 | 0.862 | 0.000 | 0.000 | 0.138 |
| Plot | Mito | Lyso or Perox | ER | Golgi | PM | Cytosol | Nucleus | ||||||
| Expt B |
2 peptides |
2 spectra |
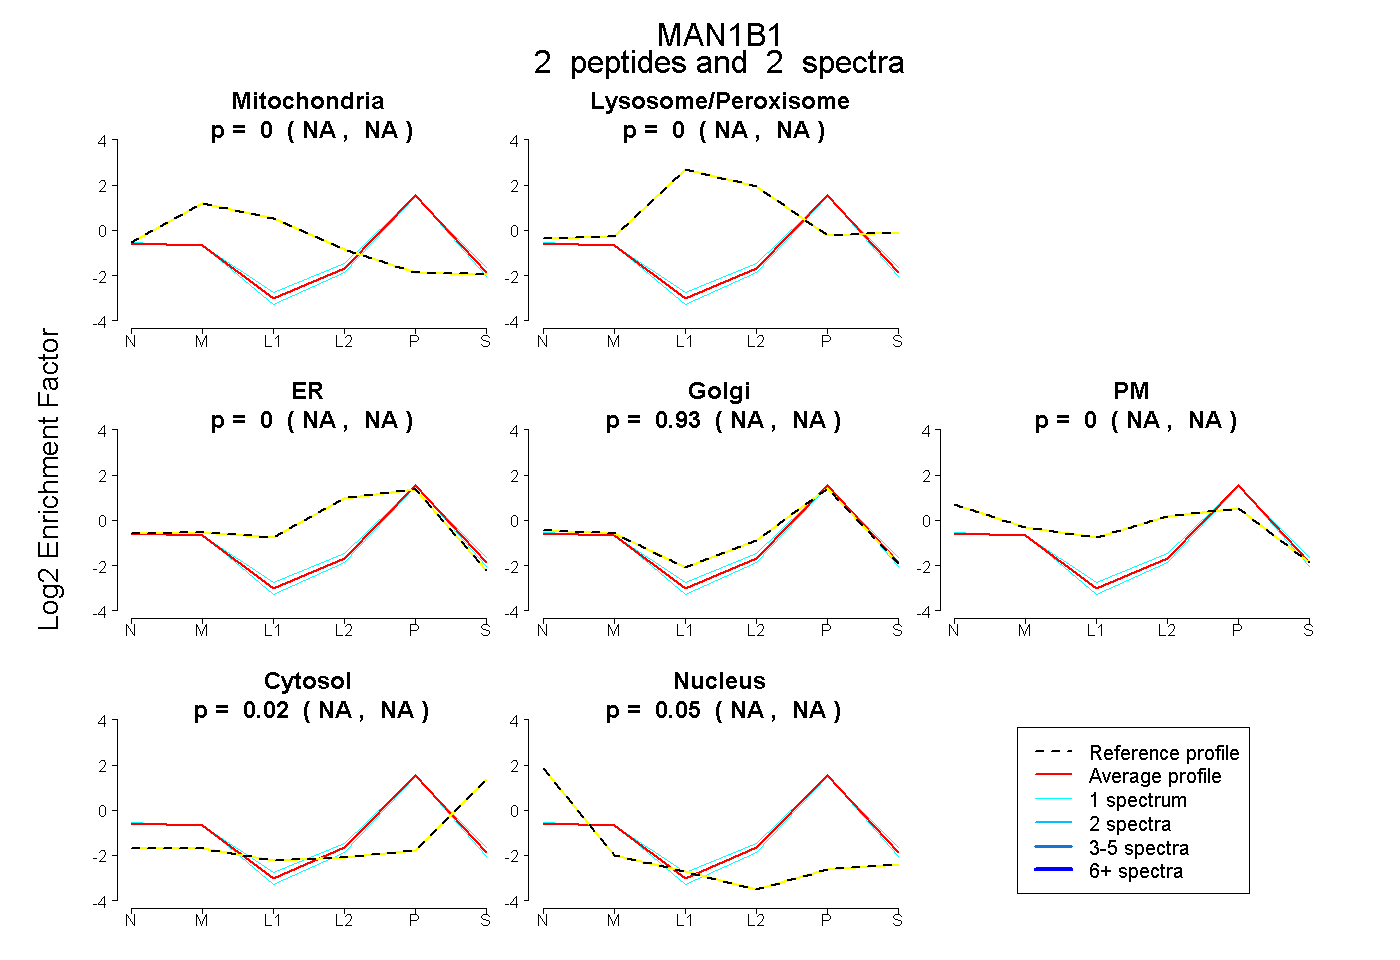 |
0.000 NA | NA |
0.000 NA | NA |
0.000 NA | NA |
0.930 NA | NA |
0.000 NA | NA |
0.015 NA | NA |
0.054 NA | NA |
|||
| Plot | Lyso | Other | |||||||||||
| Expt C |
7 peptides |
12 spectra |
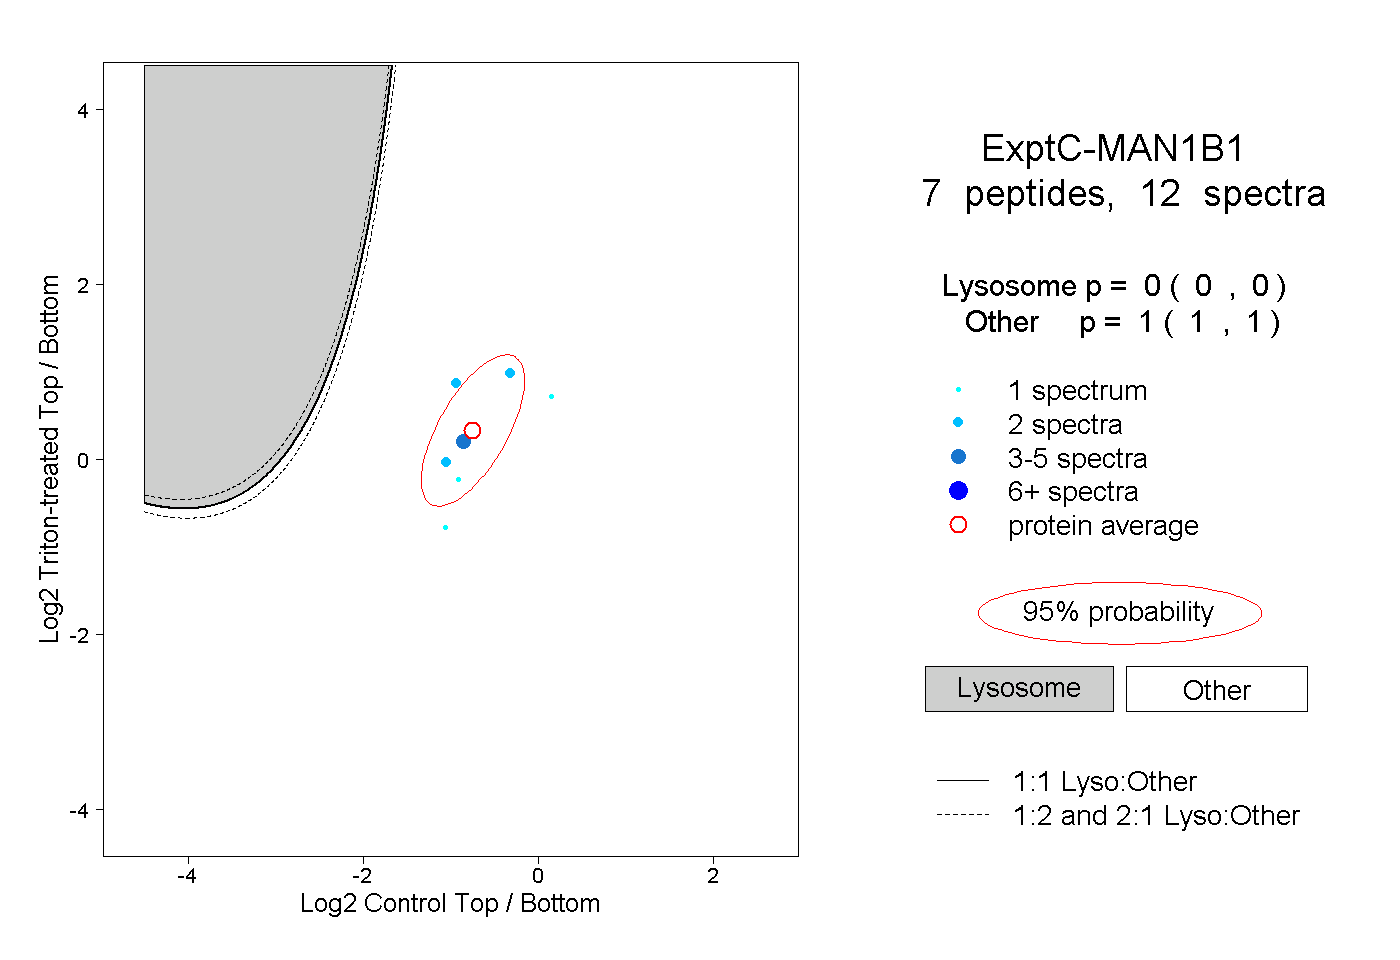 |
0.000 0.000 | 0.000 |
1.000 1.000 | 1.000 |