 6
6peptides
spectra
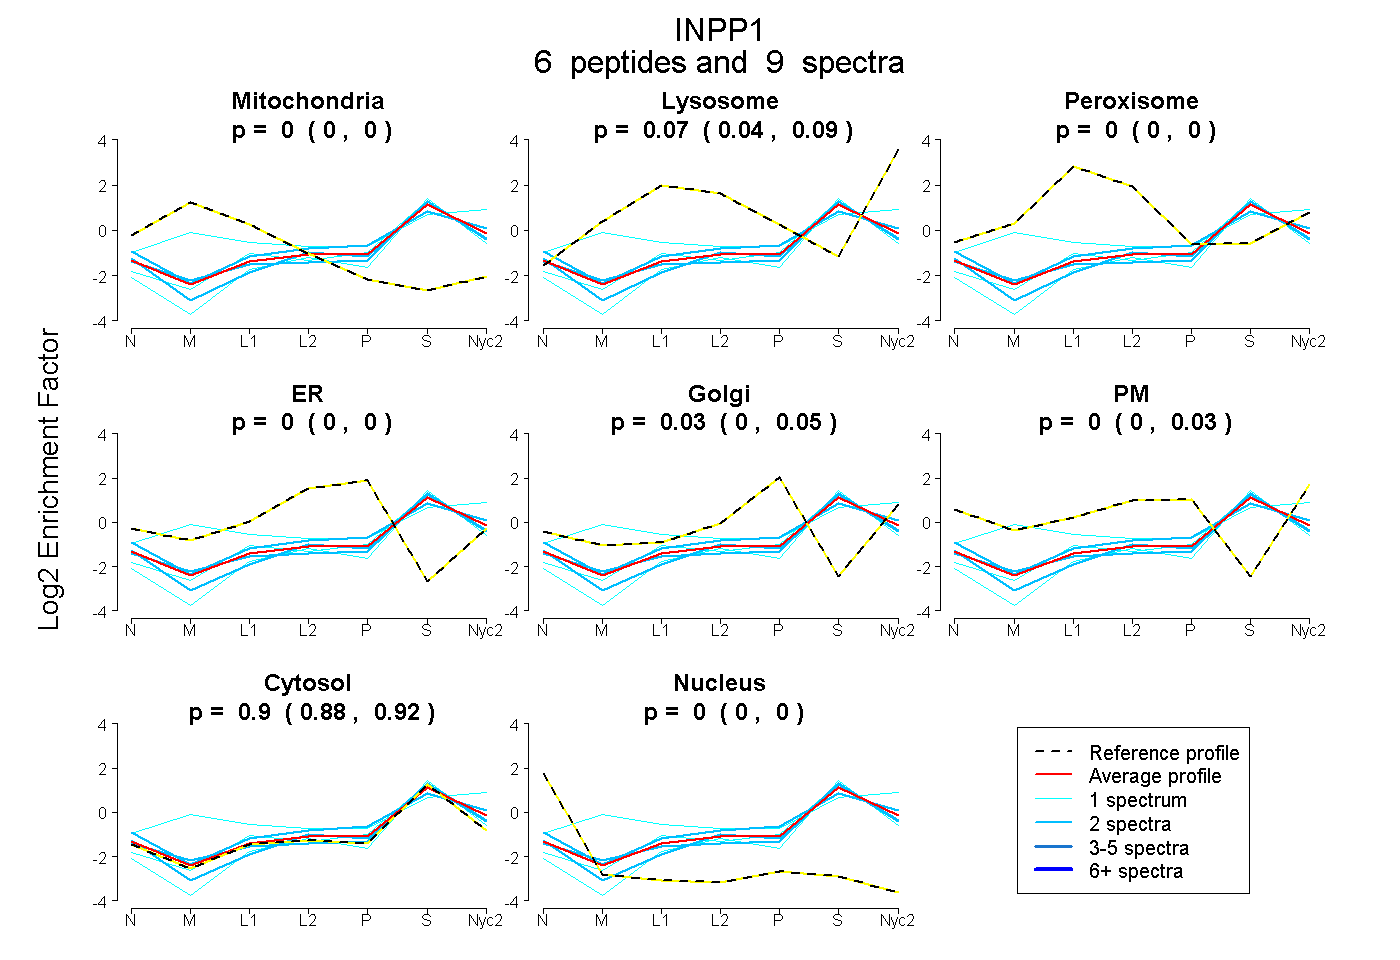
0.000 | 0.000
0.037 | 0.094
0.000 | 0.000
0.000 | 0.000
0.000 | 0.052
0.000 | 0.034
0.877 | 0.920
0.000 | 0.000
| Plot | Mito | Lyso | Perox | ER | Golgi | PM | Cytosol | Nucleus | |||||
| Expt A |
6 peptides |
9 spectra |
|
0.000 0.000 | 0.000 |
0.071 0.037 | 0.094 |
0.000 0.000 | 0.000 |
0.000 0.000 | 0.000 |
0.029 0.000 | 0.052 |
0.000 0.000 | 0.034 |
0.900 0.877 | 0.920 |
0.000 0.000 | 0.000 |
| 2 spectra, TLADVLVQEVIK | 0.000 | 0.045 | 0.000 | 0.000 | 0.036 | 0.126 | 0.793 | 0.000 | ||
| 1 spectrum, ETAELLSR | 0.000 | 0.063 | 0.000 | 0.000 | 0.000 | 0.000 | 0.937 | 0.000 | ||
| 1 spectrum, TALSDVCGGSVFPAAGAGYK | 0.111 | 0.349 | 0.000 | 0.000 | 0.000 | 0.000 | 0.541 | 0.000 | ||
| 2 spectra, LDTFLSR | 0.000 | 0.000 | 0.000 | 0.000 | 0.027 | 0.000 | 0.973 | 0.000 | ||
| 2 spectra, GGLIAYR | 0.000 | 0.041 | 0.000 | 0.000 | 0.000 | 0.000 | 0.959 | 0.000 | ||
| 1 spectrum, FAADFK | 0.000 | 0.000 | 0.000 | 0.000 | 0.000 | 0.000 | 1.000 | 0.000 |
| Plot | Lyso | Other | |||||||||||
| Expt C |
3 peptides |
5 spectra |
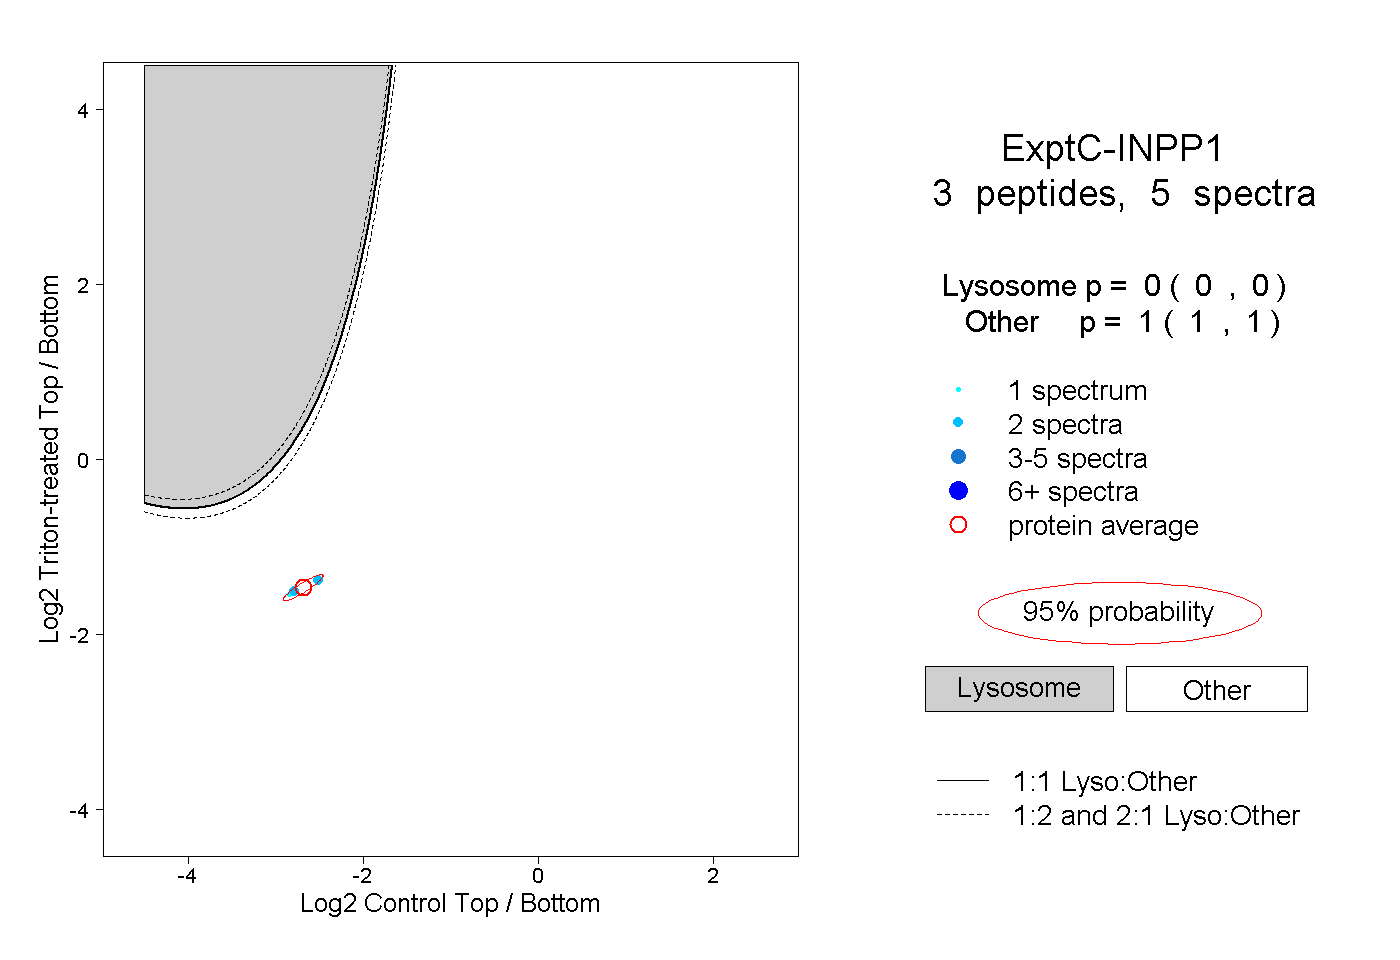 |
0.000 0.000 | 0.000 |
1.000 1.000 | 1.000 |