 2
2peptides
spectra
0.000 | 0.068
0.000 | 0.000
0.000 | 0.138
0.465 | 0.640
0.051 | 0.261
0.066 | 0.281
0.000 | 0.015
0.000 | 0.003
| Plot | Mito | Lyso | Perox | ER | Golgi | PM | Cytosol | Nucleus | |||||
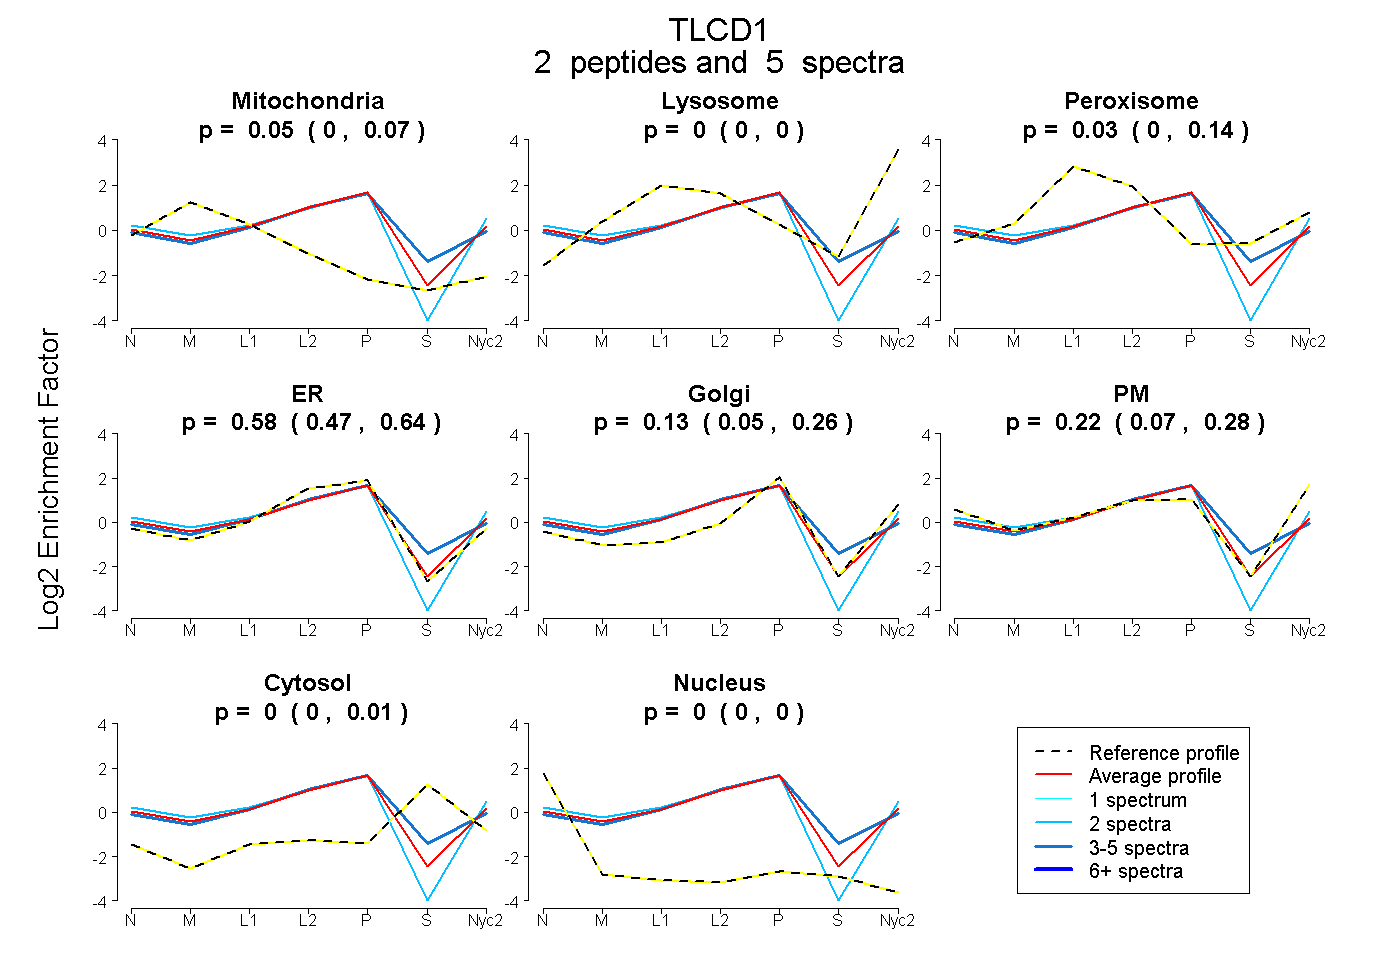
| Expt A |
2 peptides |
5 spectra |
|
0.050 0.000 | 0.068 |
0.000 0.000 | 0.000 |
0.029 0.000 | 0.138 |
0.579 0.465 | 0.640 |
0.126 0.051 | 0.261 |
0.216 0.066 | 0.281 |
0.000 0.000 | 0.015 |
0.000 0.000 | 0.003 |