 4
4peptides
spectra
0.094 | 0.245
0.017 | 0.190
0.000 | 0.111
0.000 | 0.000
0.000 | 0.054
0.000 | 0.104
0.541 | 0.662
0.000 | 0.000
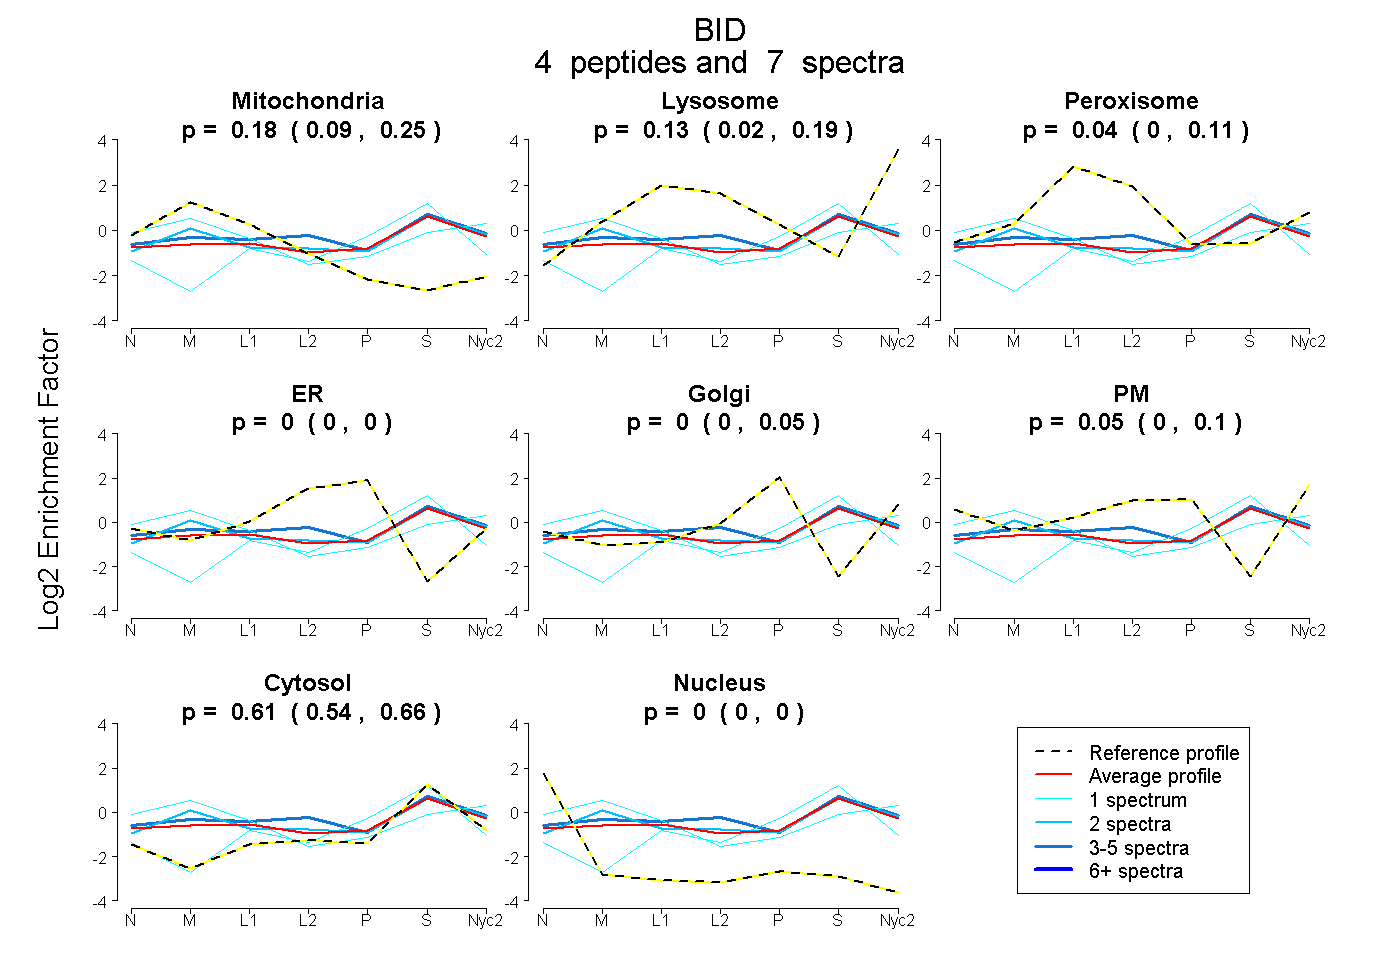
| Plot | Mito | Lyso | Perox | ER | Golgi | PM | Cytosol | Nucleus | |||||
| Expt A |
4 peptides |
7 spectra |
|
0.181 0.094 | 0.245 |
0.127 0.017 | 0.190 |
0.035 0.000 | 0.111 |
0.000 0.000 | 0.000 |
0.000 0.000 | 0.054 |
0.047 0.000 | 0.104 |
0.609 0.541 | 0.662 |
0.000 0.000 | 0.000 |
| 1 spectrum, IEPDSESQDEVIHNIAR | 0.000 | 0.000 | 0.000 | 0.077 | 0.031 | 0.000 | 0.893 | 0.000 | ||
| 1 spectrum, TTVNFINQNLFSYVR | 0.379 | 0.187 | 0.000 | 0.000 | 0.000 | 0.051 | 0.383 | 0.000 | ||
| 2 spectra, VASHAPSLLR | 0.250 | 0.202 | 0.000 | 0.000 | 0.000 | 0.000 | 0.548 | 0.000 | ||
| 3 spectra, HLAQAGDELDHSIQPTLVR | 0.125 | 0.068 | 0.214 | 0.000 | 0.000 | 0.052 | 0.542 | 0.000 |
| Plot | Mito | Lyso or Perox | ER | Golgi | PM | Cytosol | Nucleus | ||||||
| Expt B |
1 peptide |
2 spectra |
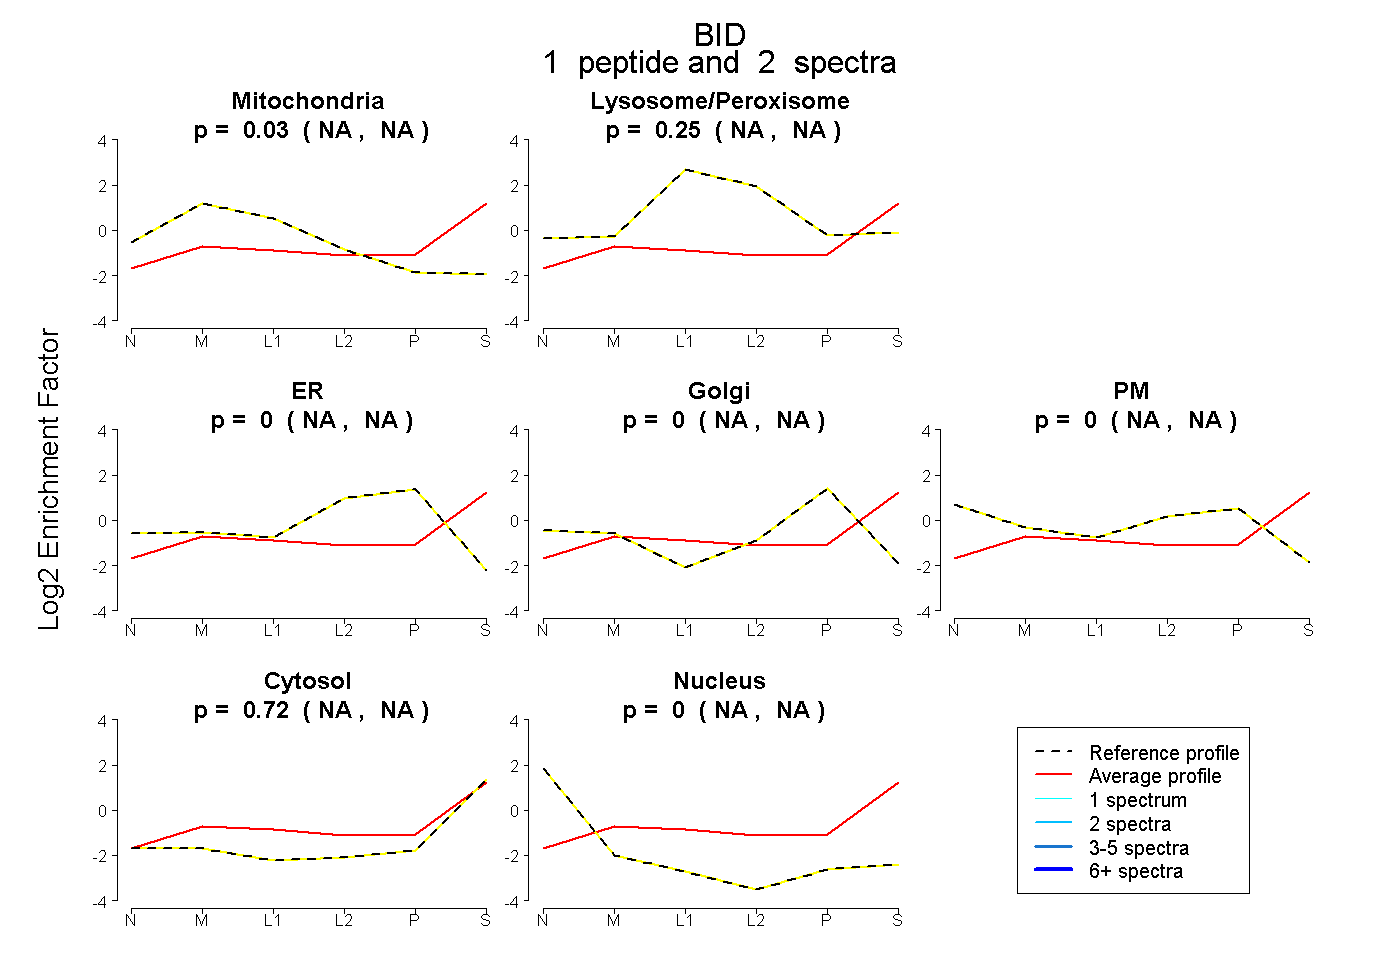 |
0.029 NA | NA |
0.254 NA | NA |
0.000 NA | NA |
0.000 NA | NA |
0.000 NA | NA |
0.717 NA | NA |
0.000 NA | NA |
|||
| Plot | Lyso | Other | |||||||||||
| Expt C |
3 peptides |
4 spectra |
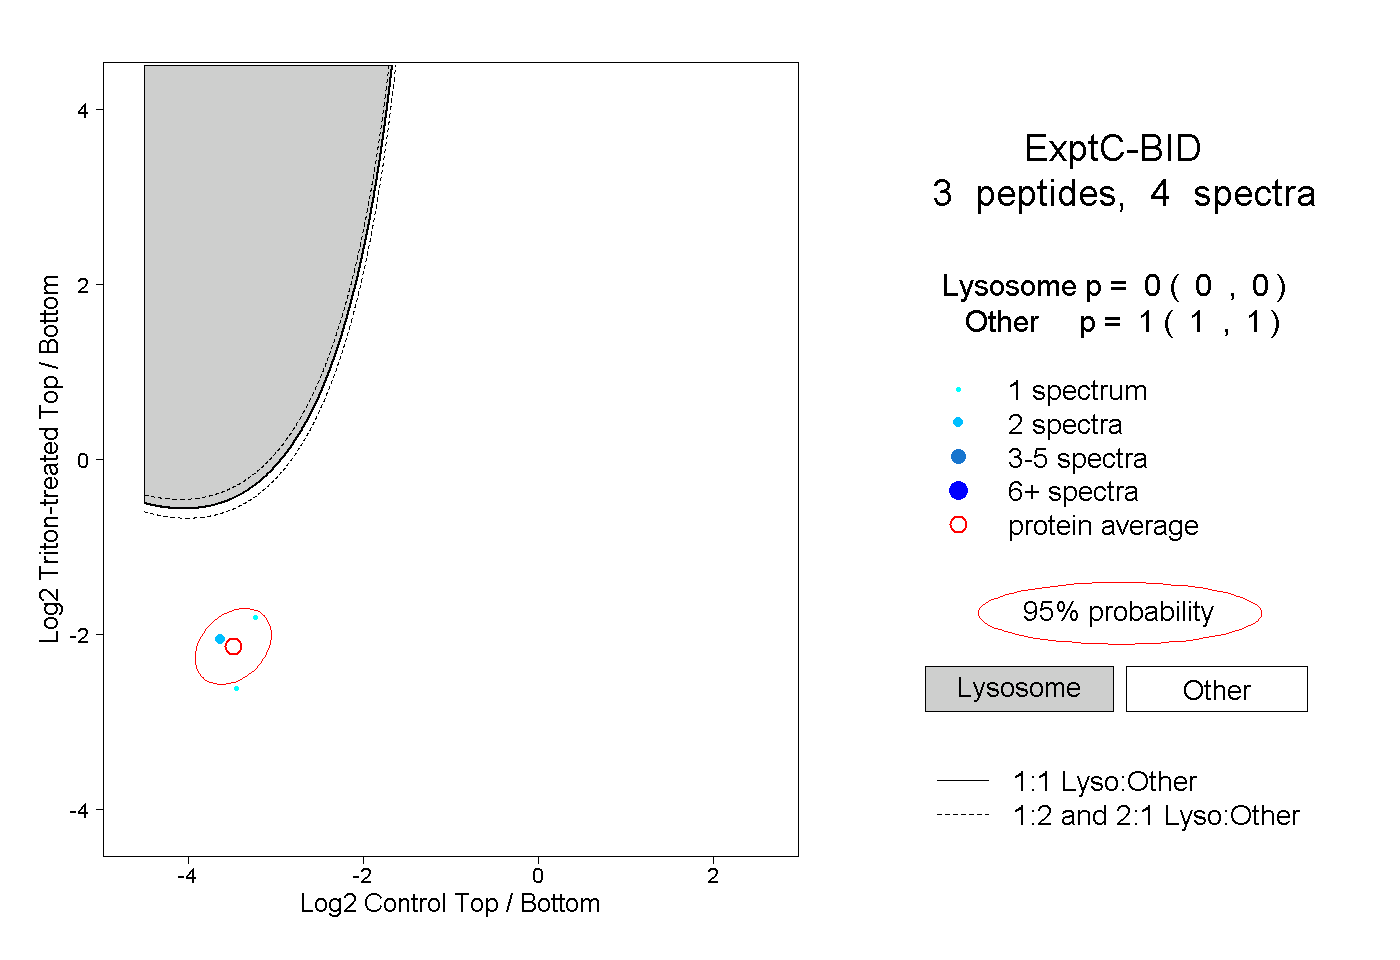 |
0.000 0.000 | 0.000 |
1.000 1.000 | 1.000 |
||||||||
| Plot | Lyso | Other | |||||||||||
| Expt D |
2 peptides |
4 spectra |
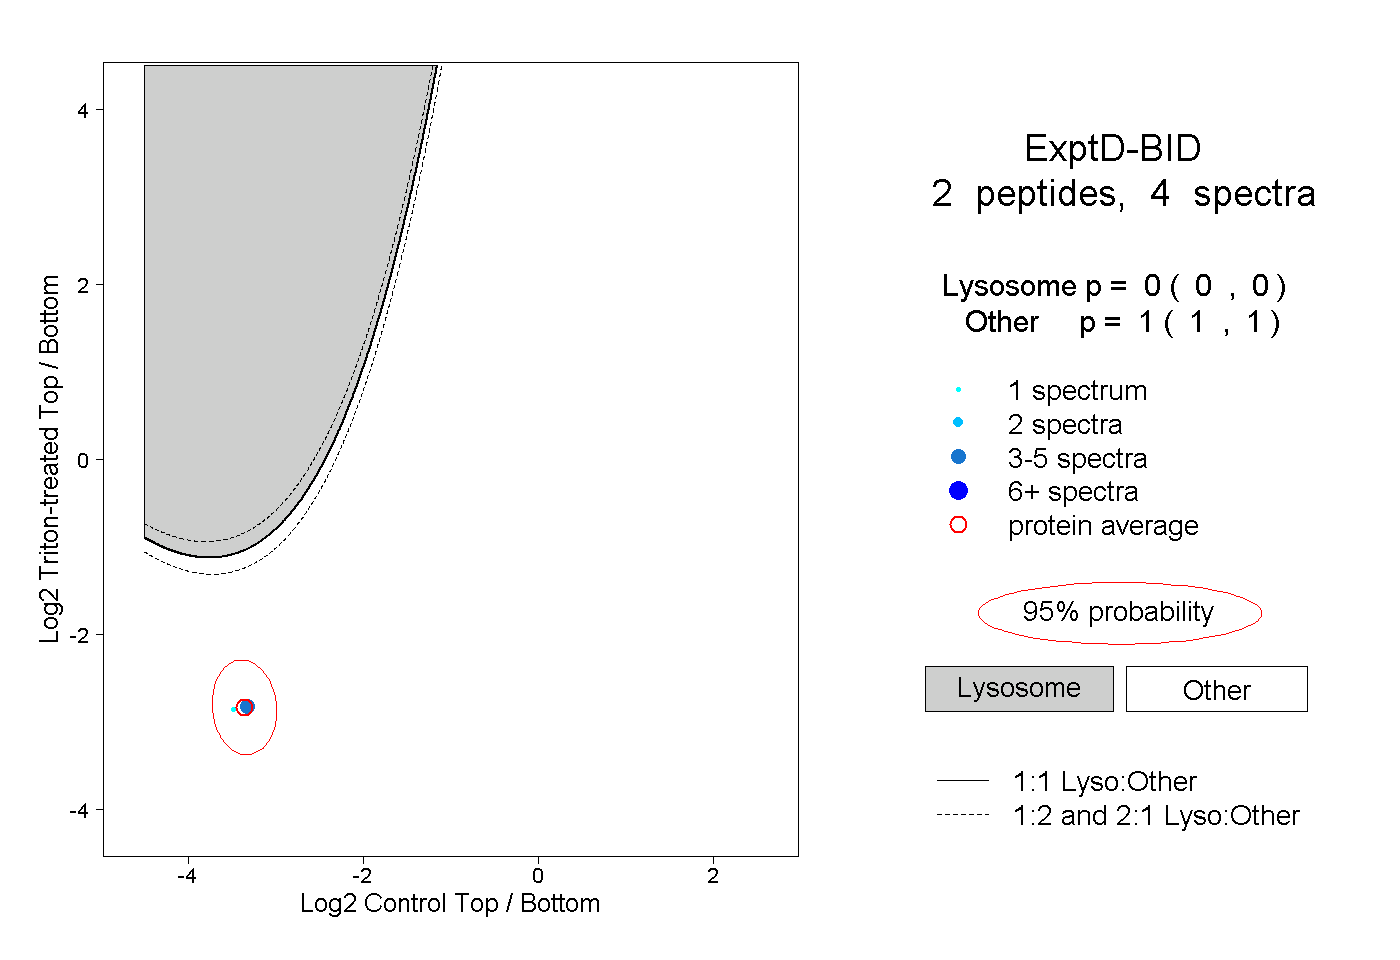 |
0.000 0.000 | 0.000 |
1.000 1.000 | 1.000 |