 4
4peptides
spectra
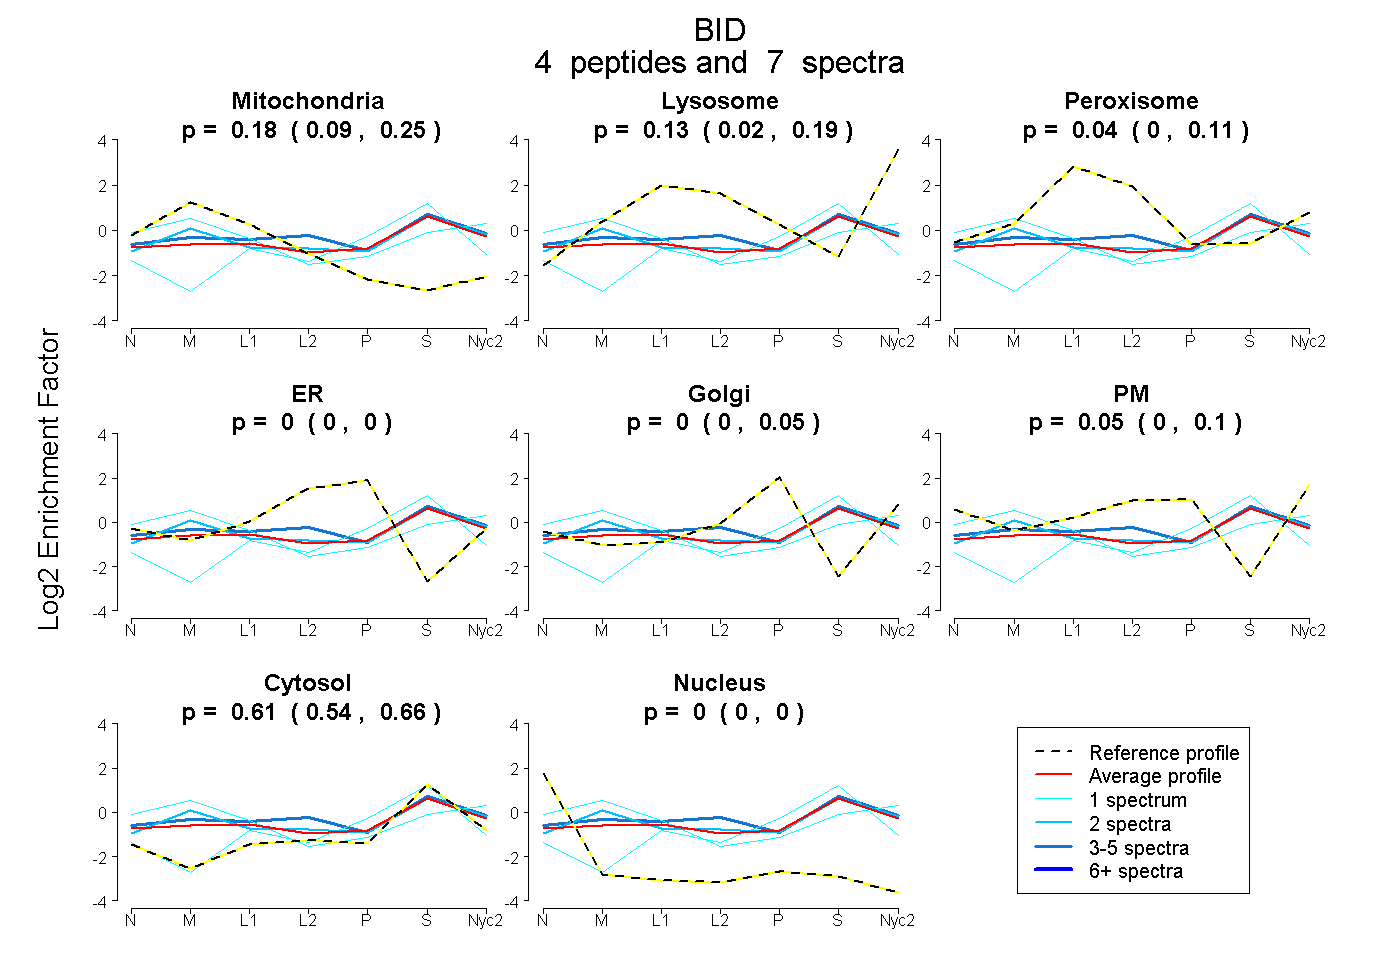
0.094 | 0.245
0.017 | 0.190
0.000 | 0.111
0.000 | 0.000
0.000 | 0.054
0.000 | 0.104
0.541 | 0.662
0.000 | 0.000
1peptide
spectra
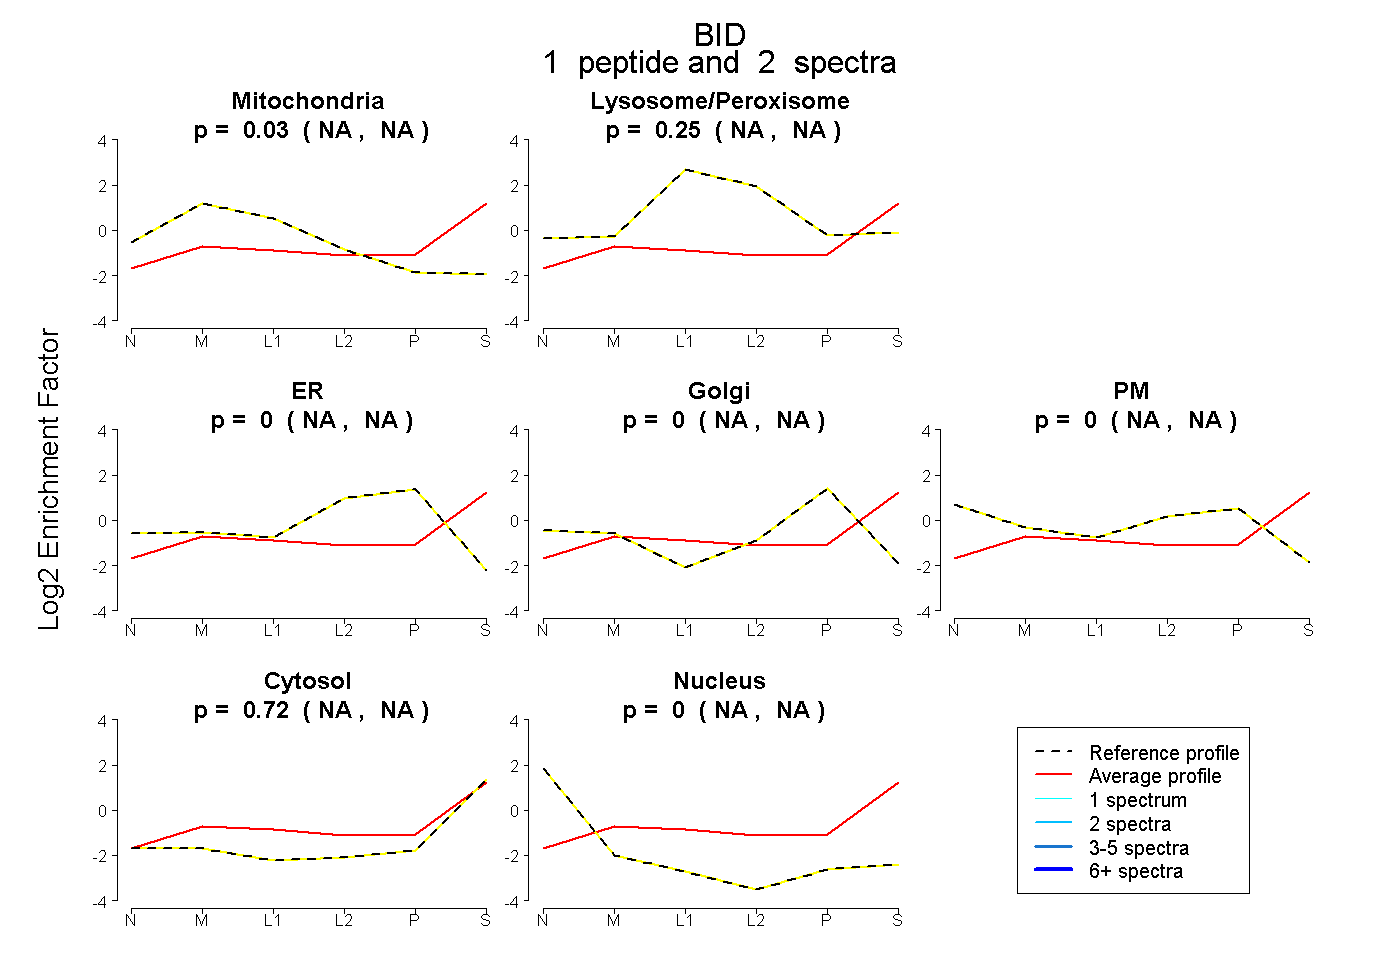
NA | NA
NA | NA
NA | NA
NA | NA
NA | NA
NA | NA
NA | NA
3peptides
spectra
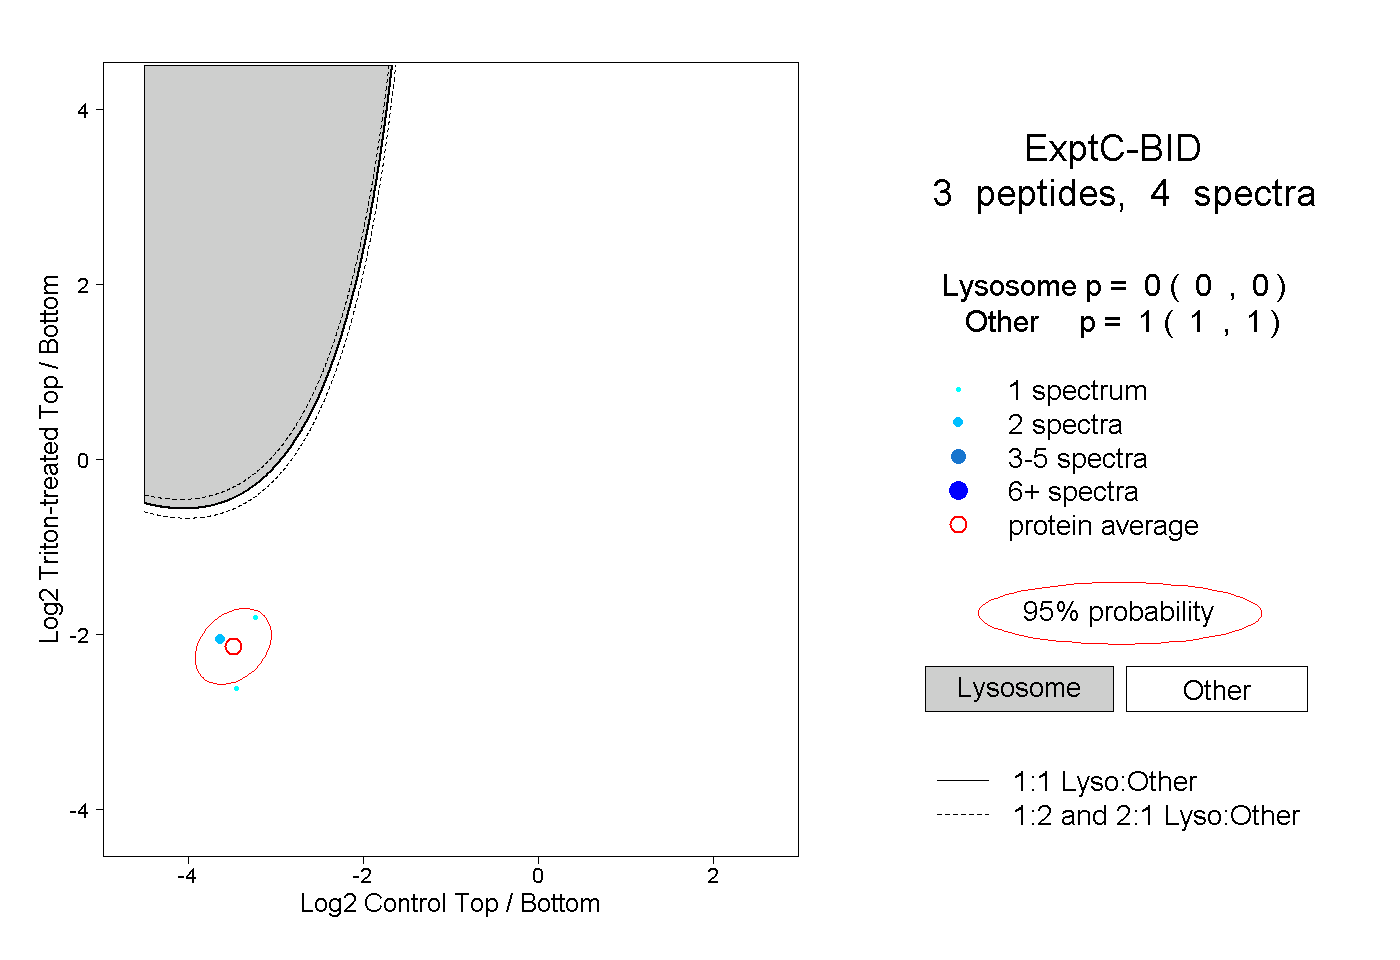
0.000 | 0.000
1.000 | 1.000
2peptides
spectra
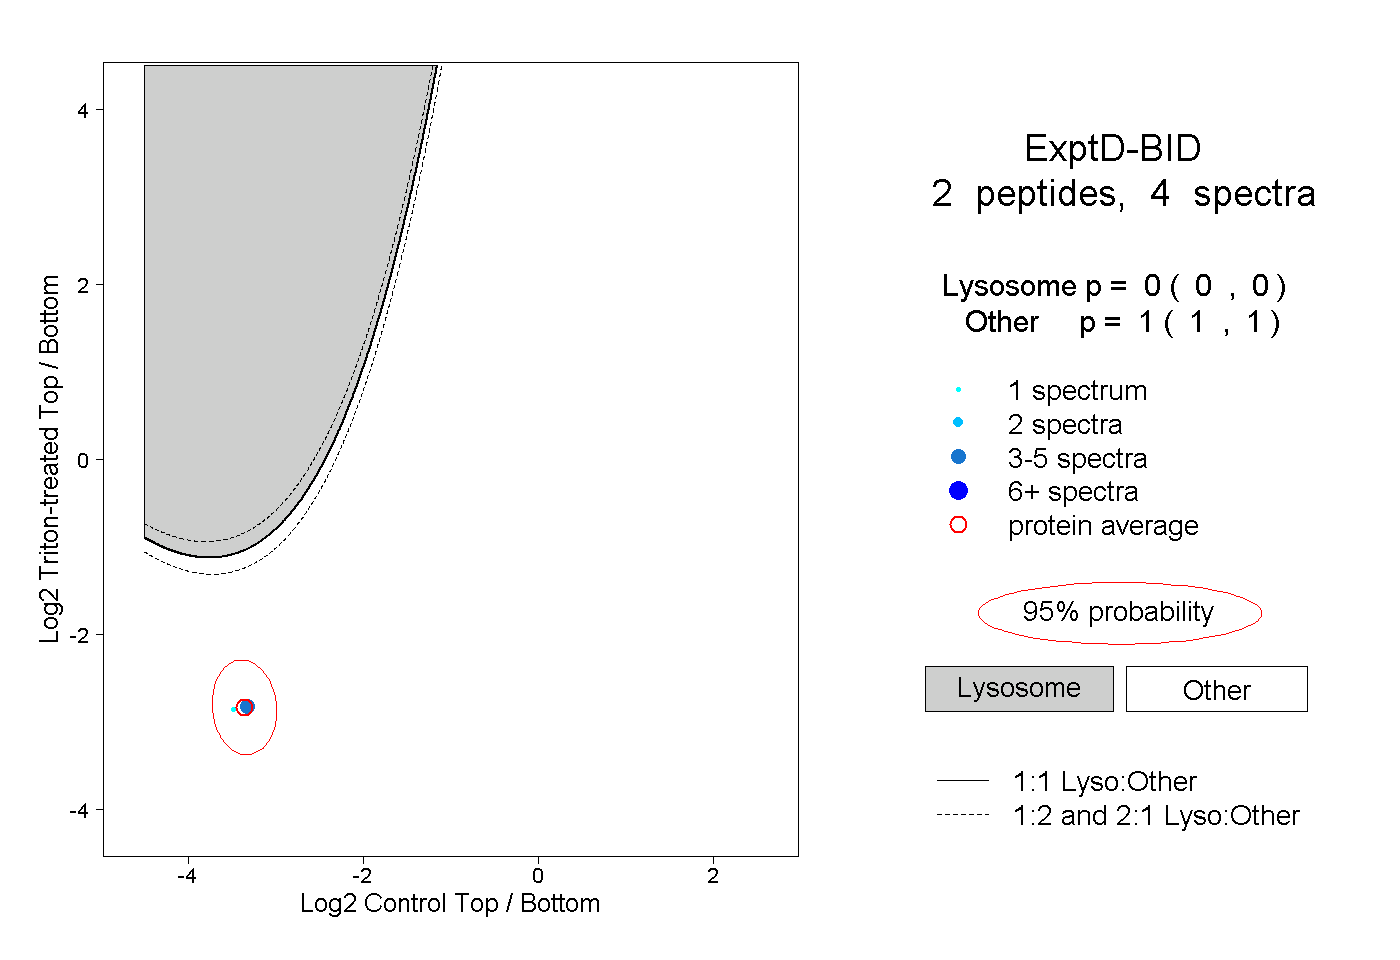
0.000 | 0.000
1.000 | 1.000