 5
5peptides
spectra
0.000 | 0.000
0.000 | 0.000
0.000 | 0.000
0.000 | 0.218
0.000 | 0.212
0.000 | 0.000
0.183 | 0.251
0.533 | 0.605
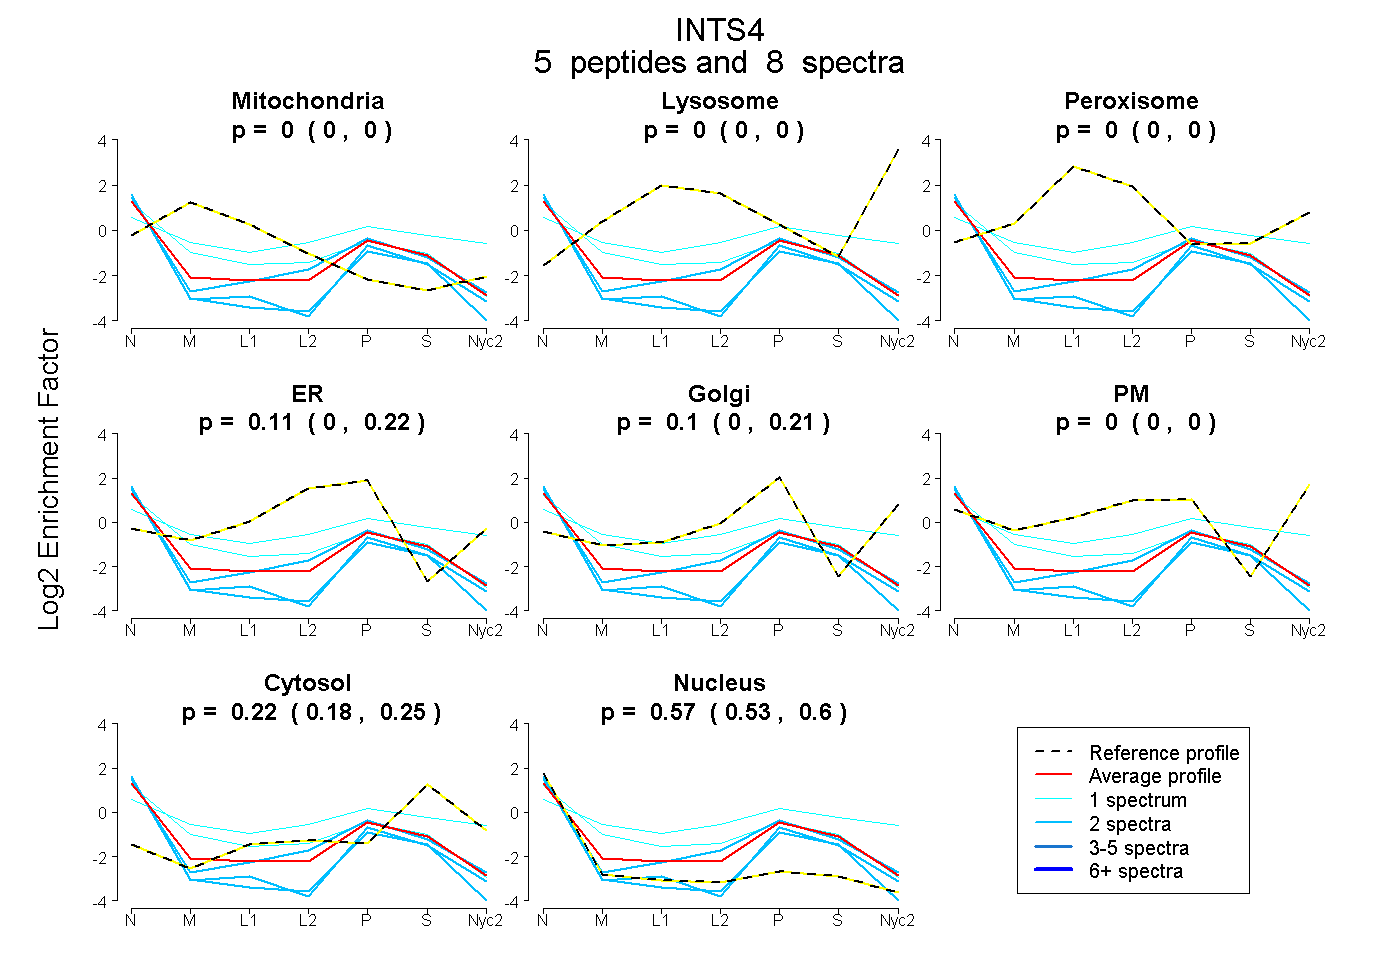
| Plot | Mito | Lyso | Perox | ER | Golgi | PM | Cytosol | Nucleus | |||||
| Expt A |
5 peptides |
8 spectra |
|
0.000 0.000 | 0.000 |
0.000 0.000 | 0.000 |
0.000 0.000 | 0.000 |
0.110 0.000 | 0.218 |
0.096 0.000 | 0.212 |
0.000 0.000 | 0.000 |
0.222 0.183 | 0.251 |
0.571 0.533 | 0.605 |
| 2 spectra, LLLAYNSGAR | 0.000 | 0.000 | 0.000 | 0.000 | 0.000 | 0.000 | 0.143 | 0.857 | ||
| 1 spectrum, DSLSHLVPALR | 0.108 | 0.000 | 0.000 | 0.055 | 0.050 | 0.330 | 0.386 | 0.071 | ||
| 2 spectra, LPENQATQVR | 0.000 | 0.000 | 0.000 | 0.208 | 0.019 | 0.000 | 0.206 | 0.567 | ||
| 1 spectrum, LLDLMPR | 0.150 | 0.000 | 0.000 | 0.243 | 0.000 | 0.000 | 0.185 | 0.422 | ||
| 2 spectra, ALQLLVTAR | 0.000 | 0.000 | 0.000 | 0.000 | 0.076 | 0.000 | 0.149 | 0.775 |
| Plot | Mito | Lyso or Perox | ER | Golgi | PM | Cytosol | Nucleus | ||||||
| Expt B |
1 peptide |
1 spectrum |
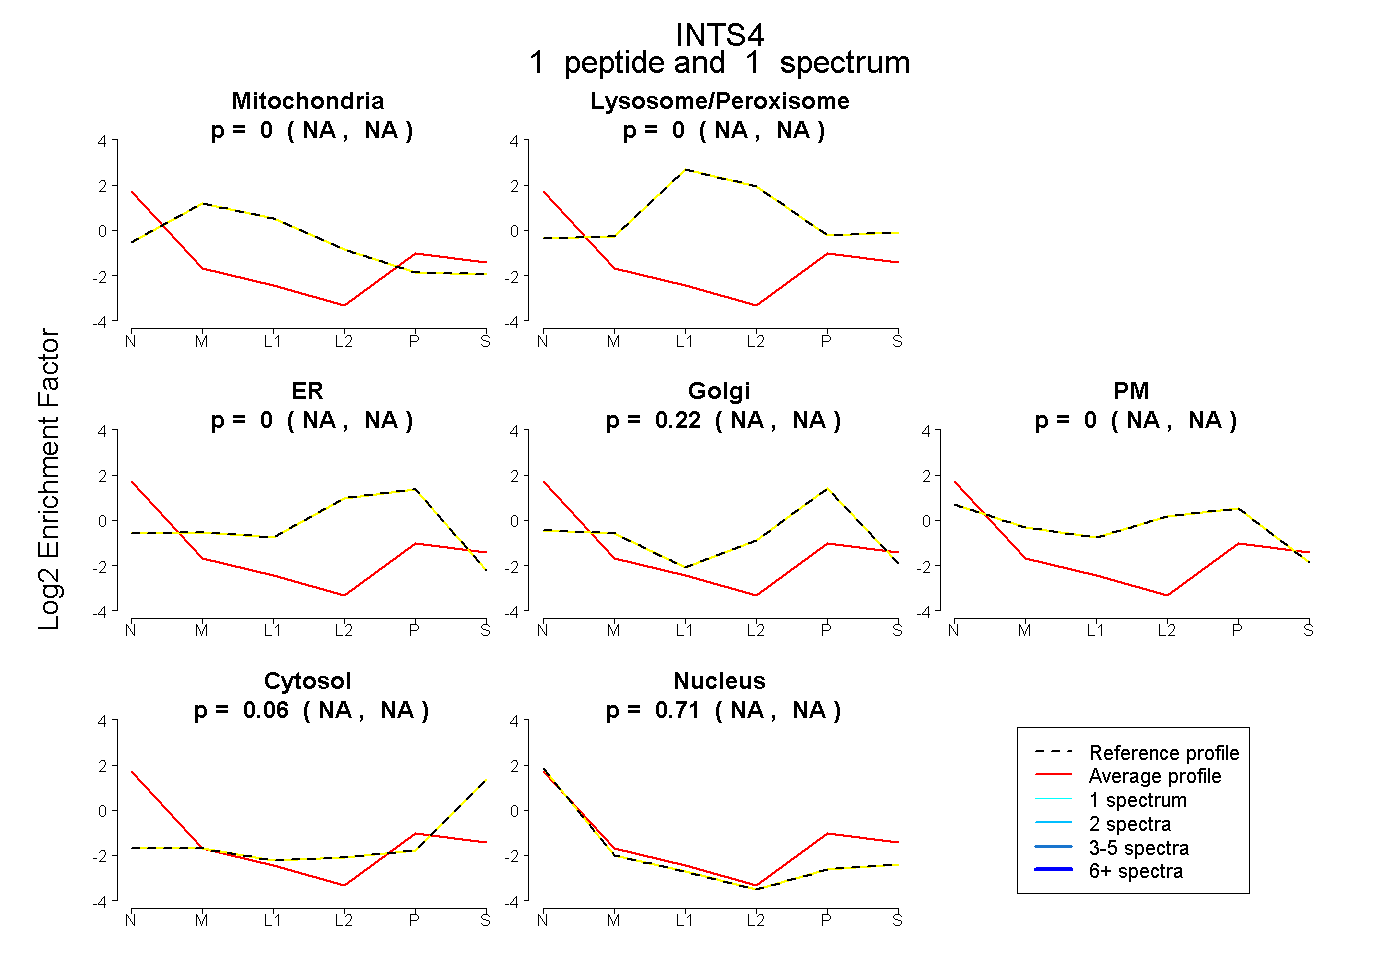 |
0.000 NA | NA |
0.000 NA | NA |
0.000 NA | NA |
0.223 NA | NA |
0.000 NA | NA |
0.065 NA | NA |
0.712 NA | NA |
|||
| Plot | Lyso | Other | |||||||||||
| Expt C |
1 peptide |
1 spectrum |
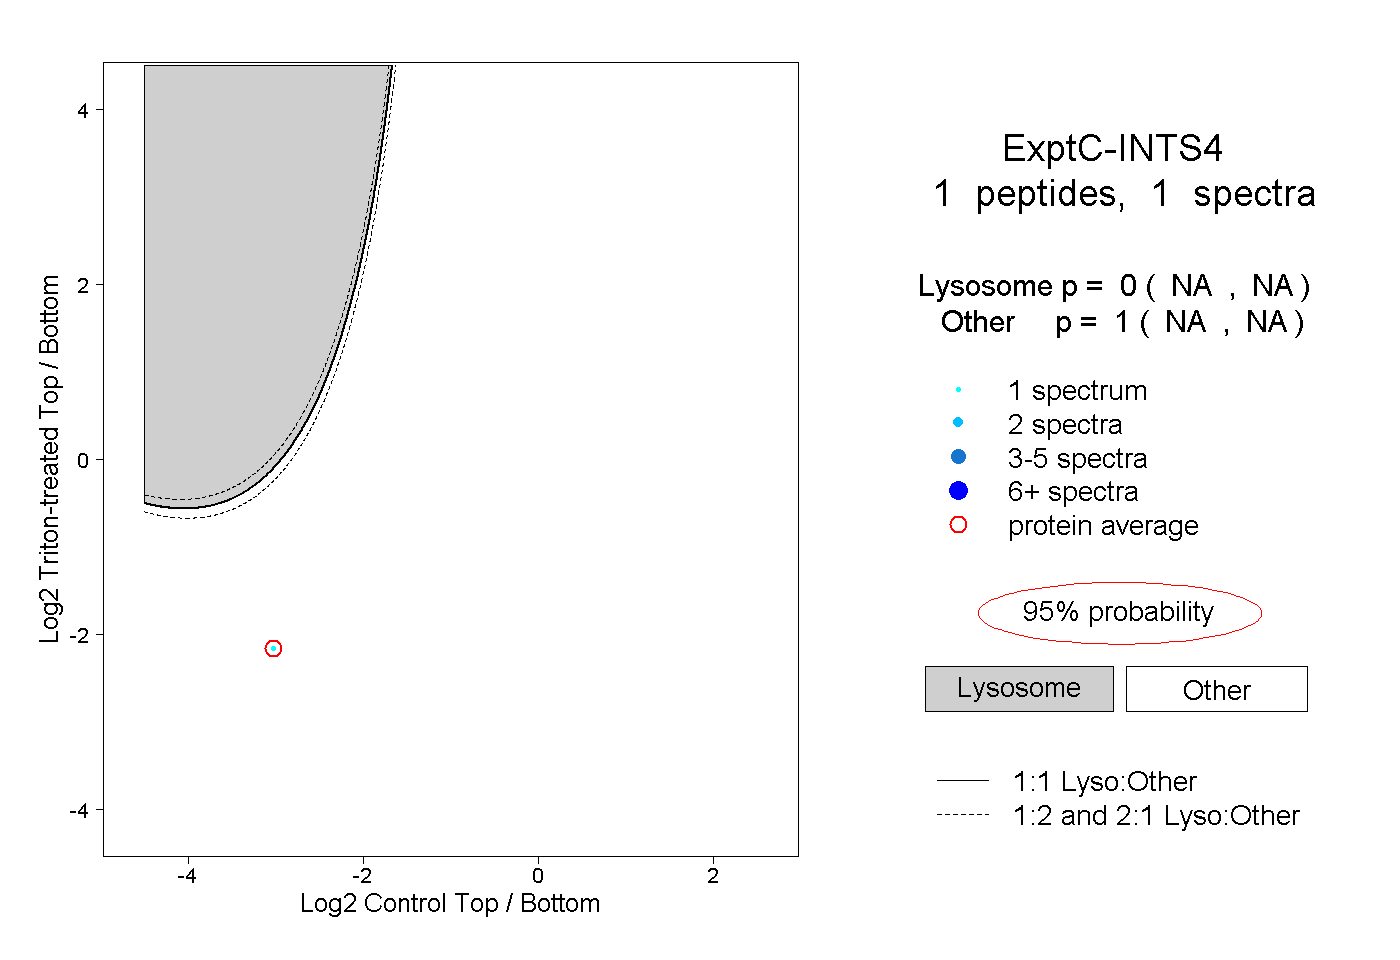 |
0.000 NA | NA |
1.000 NA | NA |