 2
2peptides
spectra
NA | NA
NA | NA
NA | NA
NA | NA
NA | NA
NA | NA
NA | NA
NA | NA
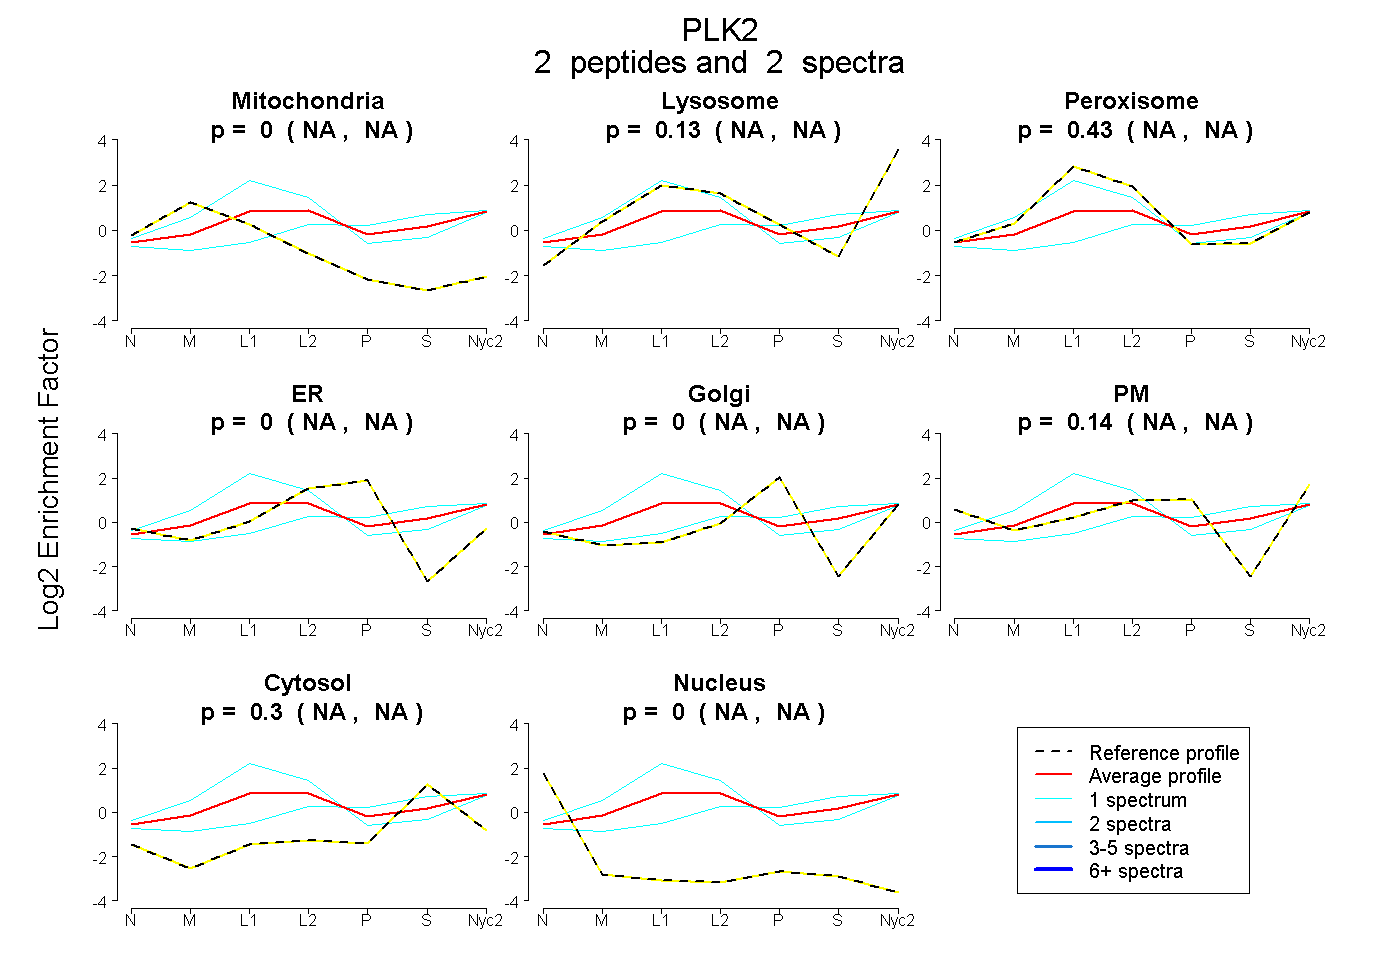
| Plot | Mito | Lyso | Perox | ER | Golgi | PM | Cytosol | Nucleus | |||||
| Expt A |
2 peptides |
2 spectra |
|
0.000 NA | NA |
0.132 NA | NA |
0.434 NA | NA |
0.000 NA | NA |
0.000 NA | NA |
0.135 NA | NA |
0.299 NA | NA |
0.000 NA | NA |
| 1 spectrum, AAAALFGGK | 0.000 | 0.266 | 0.000 | 0.020 | 0.011 | 0.183 | 0.520 | 0.000 | ||
| 1 spectrum, IIPHSR | 0.064 | 0.060 | 0.809 | 0.000 | 0.000 | 0.012 | 0.056 | 0.000 |