 10
10peptides
spectra
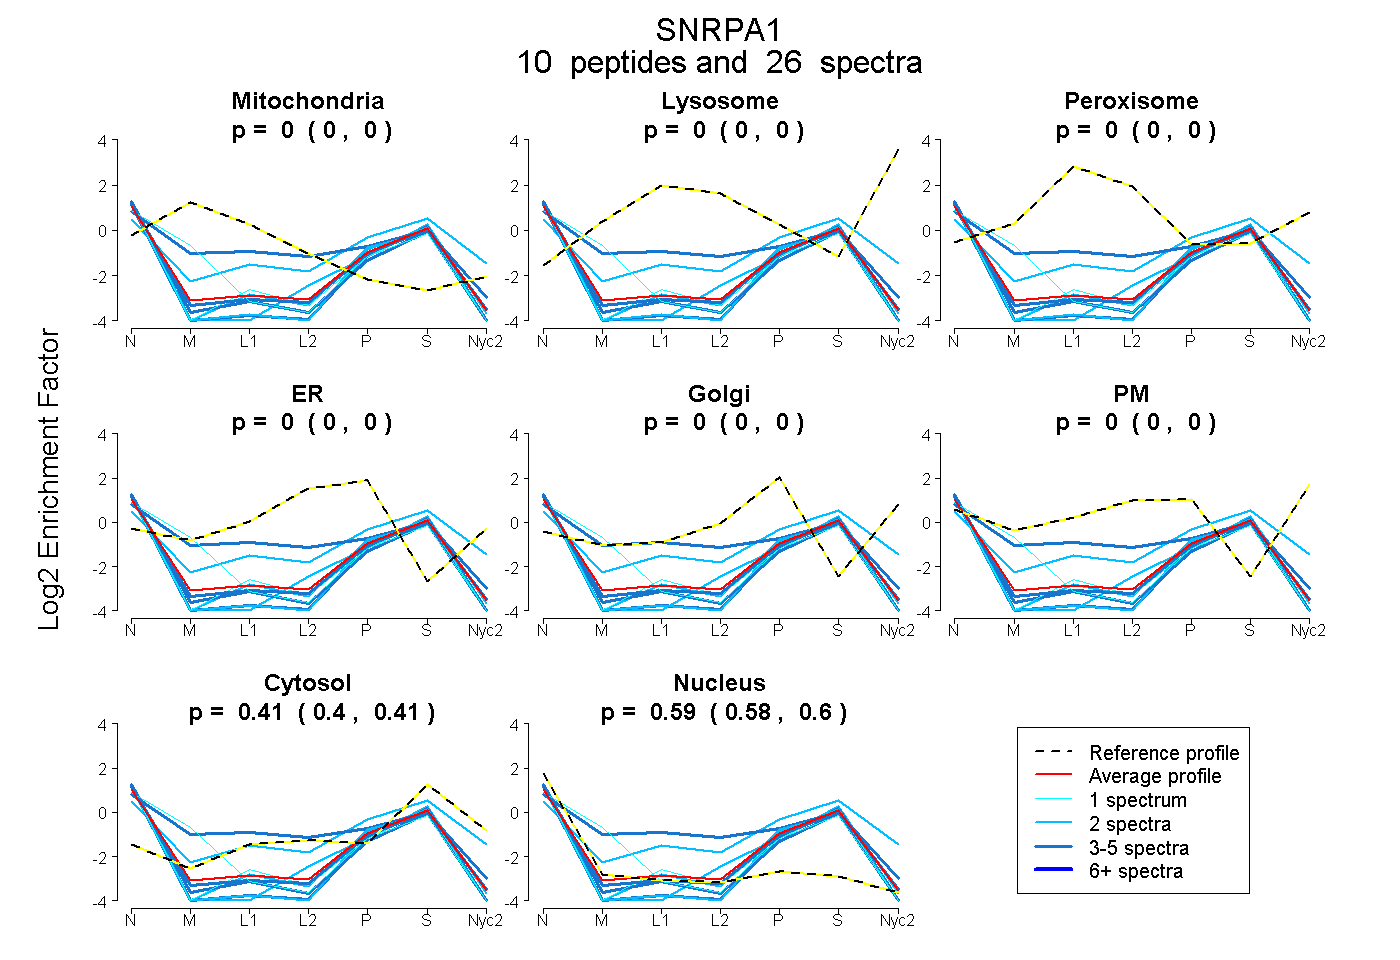
0.000 | 0.000
0.000 | 0.000
0.000 | 0.000
0.000 | 0.000
0.000 | 0.000
0.000 | 0.000
0.396 | 0.414
0.583 | 0.602
| Plot | Mito | Lyso | Perox | ER | Golgi | PM | Cytosol | Nucleus | |||||
| Expt A |
10 peptides |
26 spectra |
|
0.000 0.000 | 0.000 |
0.000 0.000 | 0.000 |
0.000 0.000 | 0.000 |
0.000 0.000 | 0.000 |
0.000 0.000 | 0.000 |
0.000 0.000 | 0.000 |
0.406 0.396 | 0.414 |
0.594 0.583 | 0.602 |
| 2 spectra, NAIANASTLAEVER | 0.000 | 0.000 | 0.000 | 0.000 | 0.000 | 0.000 | 0.332 | 0.668 | ||
| 3 spectra, LYVIYK | 0.157 | 0.000 | 0.098 | 0.088 | 0.000 | 0.000 | 0.349 | 0.308 | ||
| 2 spectra, LDGFPLLR | 0.000 | 0.000 | 0.000 | 0.000 | 0.000 | 0.000 | 0.296 | 0.704 | ||
| 2 spectra, GGPSAGDVEAIK | 0.000 | 0.000 | 0.000 | 0.000 | 0.000 | 0.000 | 0.381 | 0.619 | ||
| 3 spectra, SLTYLSILR | 0.000 | 0.000 | 0.000 | 0.000 | 0.000 | 0.000 | 0.295 | 0.705 | ||
| 1 spectrum, TFNPGAGLPTDK | 0.000 | 0.000 | 0.000 | 0.000 | 0.000 | 0.000 | 0.355 | 0.645 | ||
| 1 spectrum, VLDFQK | 0.082 | 0.000 | 0.000 | 0.000 | 0.000 | 0.000 | 0.294 | 0.624 | ||
| 5 spectra, TLLVNNNR | 0.000 | 0.000 | 0.000 | 0.000 | 0.000 | 0.000 | 0.377 | 0.623 | ||
| 5 spectra, GLLQSGQIPGR | 0.000 | 0.000 | 0.000 | 0.000 | 0.000 | 0.000 | 0.294 | 0.706 | ||
| 2 spectra, GAQLAK | 0.000 | 0.000 | 0.000 | 0.000 | 0.170 | 0.000 | 0.609 | 0.221 |
| Plot | Mito | Lyso or Perox | ER | Golgi | PM | Cytosol | Nucleus | ||||||
| Expt B |
4 peptides |
6 spectra |
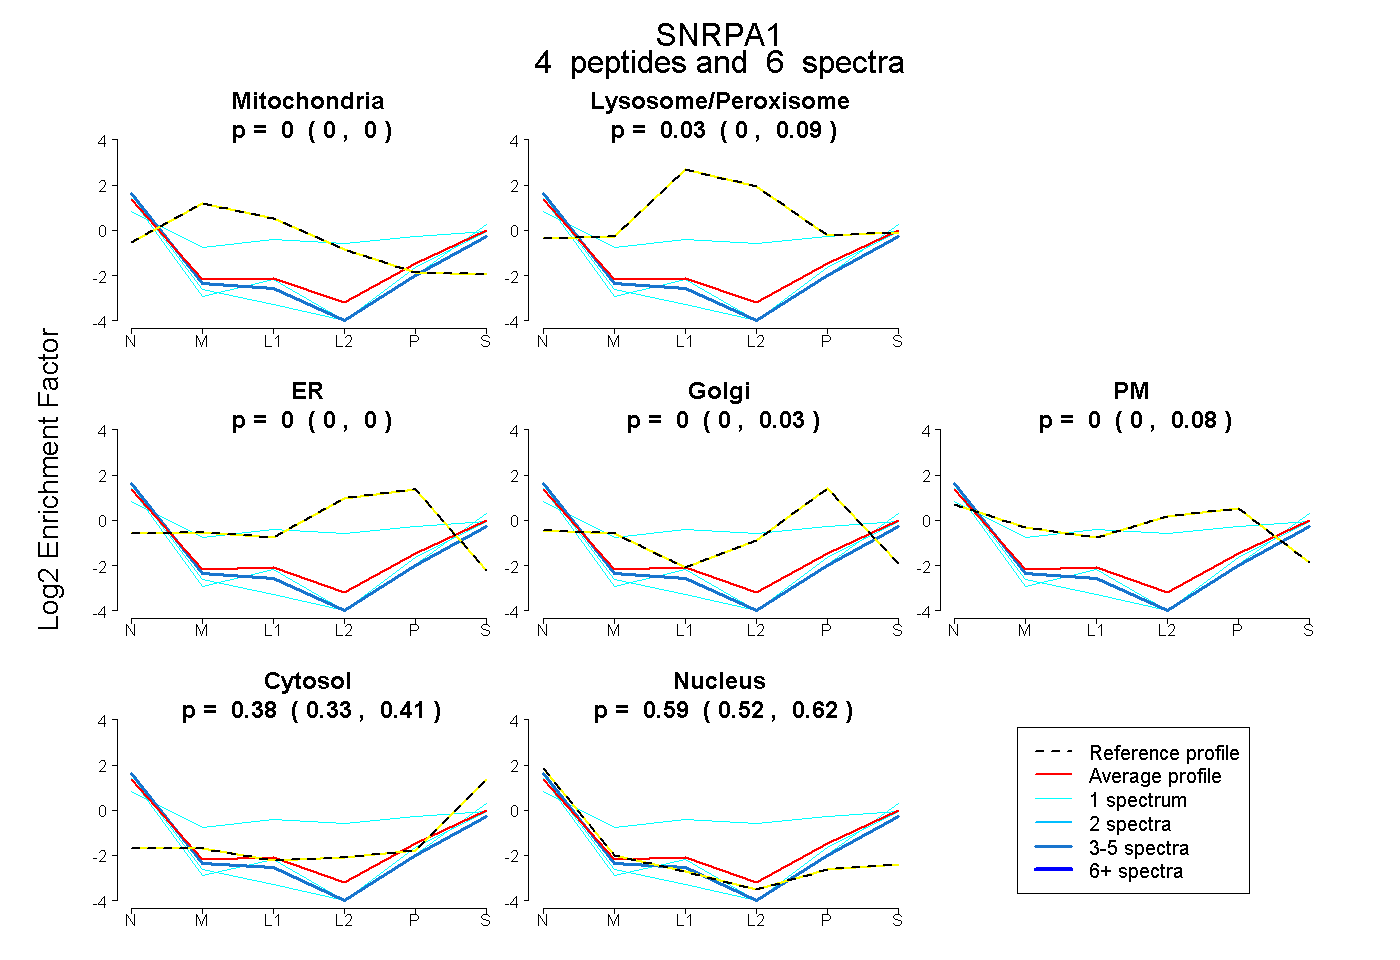 |
0.000 0.000 | 0.000 |
0.035 0.000 | 0.091 |
0.000 0.000 | 0.000 |
0.000 0.000 | 0.028 |
0.000 0.000 | 0.078 |
0.377 0.326 | 0.405 |
0.588 0.517 | 0.616 |
|||
| Plot | Lyso | Other | |||||||||||
| Expt C |
3 peptides |
6 spectra |
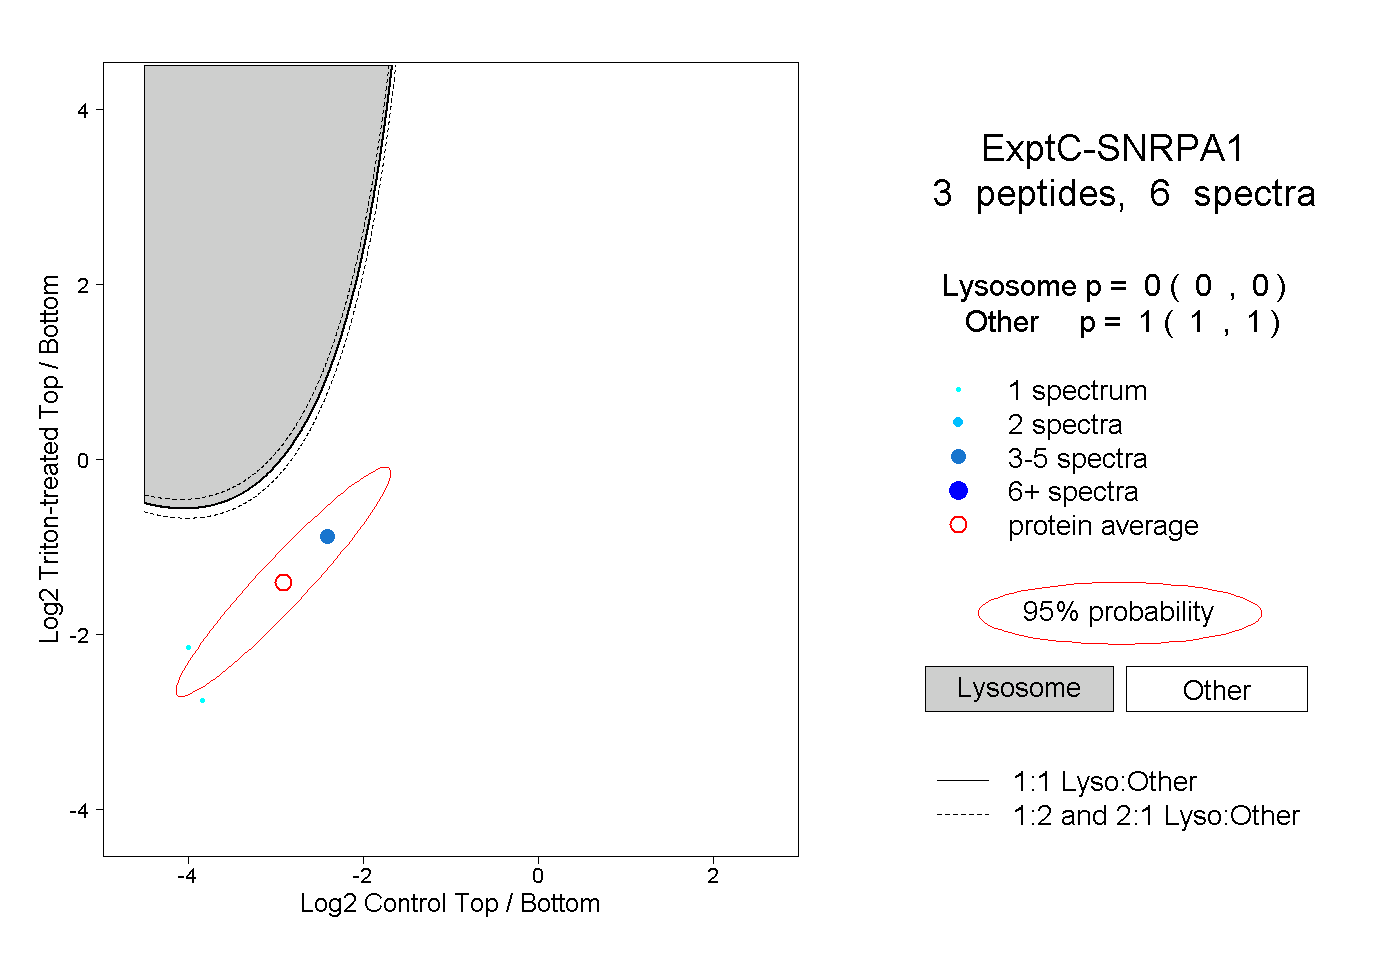 |
0.000 0.000 | 0.000 |
1.000 1.000 | 1.000 |