 2
2peptides
spectra
0.000 | 0.000
0.815 | 0.987
0.000 | 0.000
0.000 | 0.116
0.000 | 0.060
0.000 | 0.050
0.000 | 0.089
0.000 | 0.000
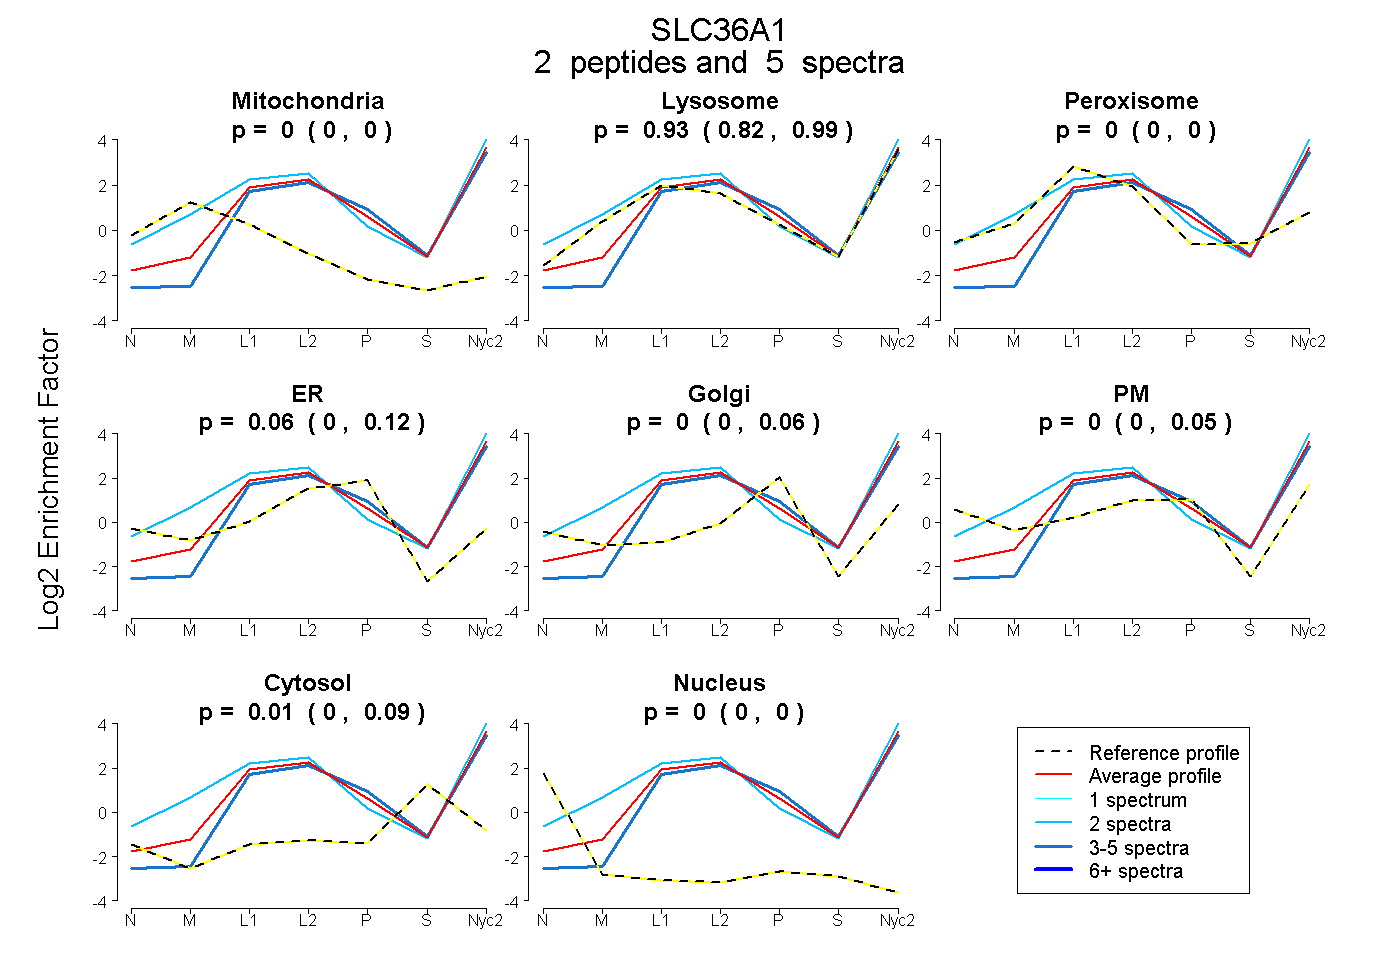
| Plot | Mito | Lyso | Perox | ER | Golgi | PM | Cytosol | Nucleus | |||||
| Expt A |
2 peptides |
5 spectra |
|
0.000 0.000 | 0.000 |
0.926 0.815 | 0.987 |
0.000 0.000 | 0.000 |
0.060 0.000 | 0.116 |
0.000 0.000 | 0.060 |
0.000 0.000 | 0.050 |
0.014 0.000 | 0.089 |
0.000 0.000 | 0.000 |
| 3 spectra, GNIGTGLLGLPLAVK | 0.000 | 0.821 | 0.000 | 0.076 | 0.004 | 0.000 | 0.100 | 0.000 | ||
| 2 spectra, FELVVDLSAR | 0.000 | 0.982 | 0.018 | 0.000 | 0.000 | 0.000 | 0.000 | 0.000 |
| Plot | Lyso | Other | |||||||||||
| Expt C |
2 peptides |
6 spectra |
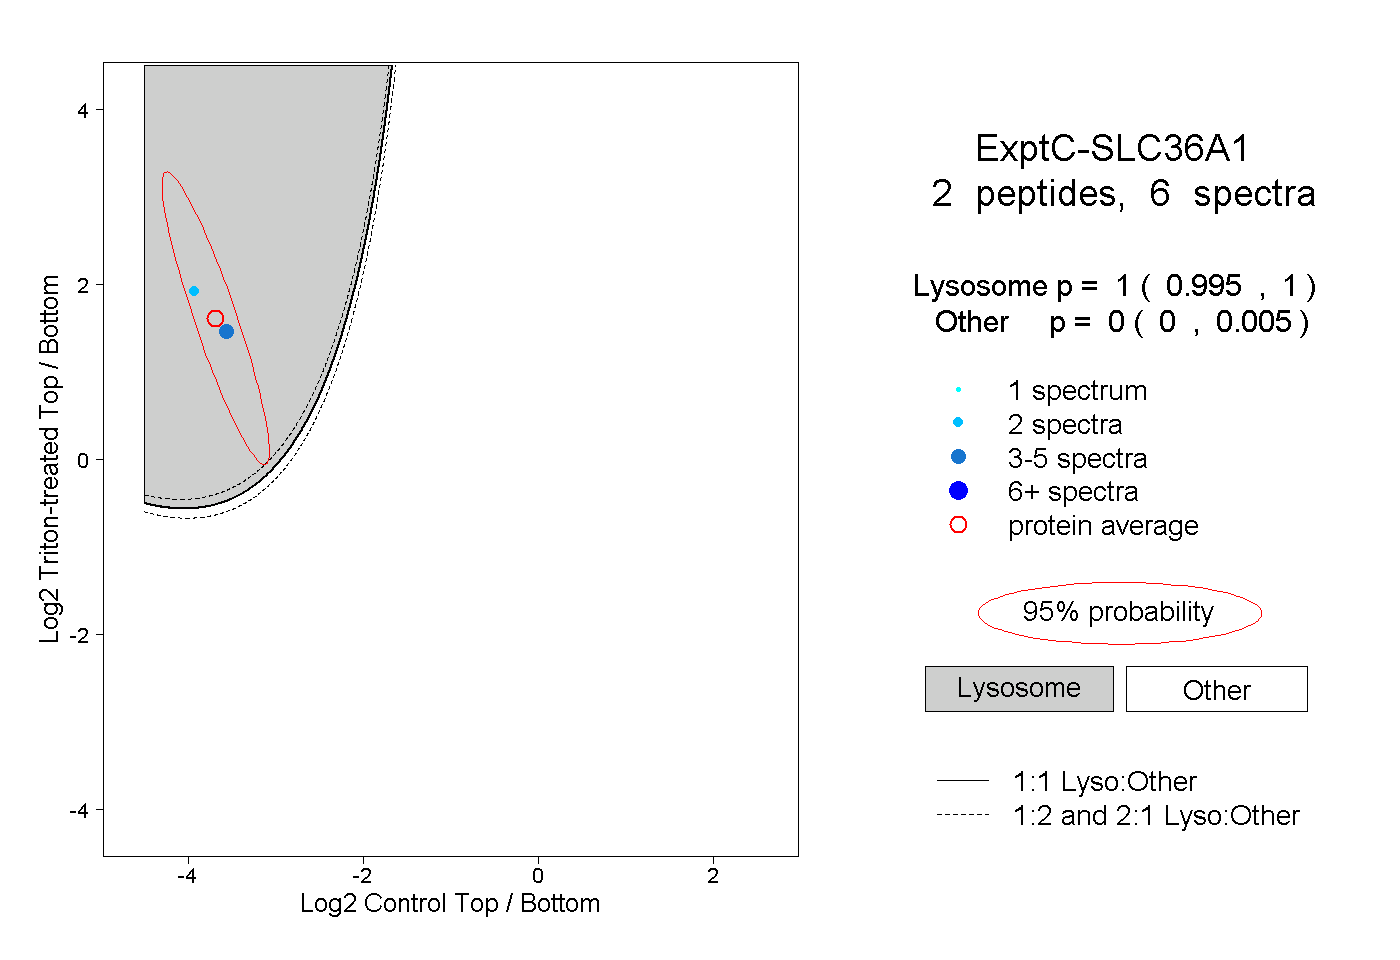 |
1.000 0.995 | 1.000 |
0.000 0.000 | 0.005 |