 3
3peptides
spectra
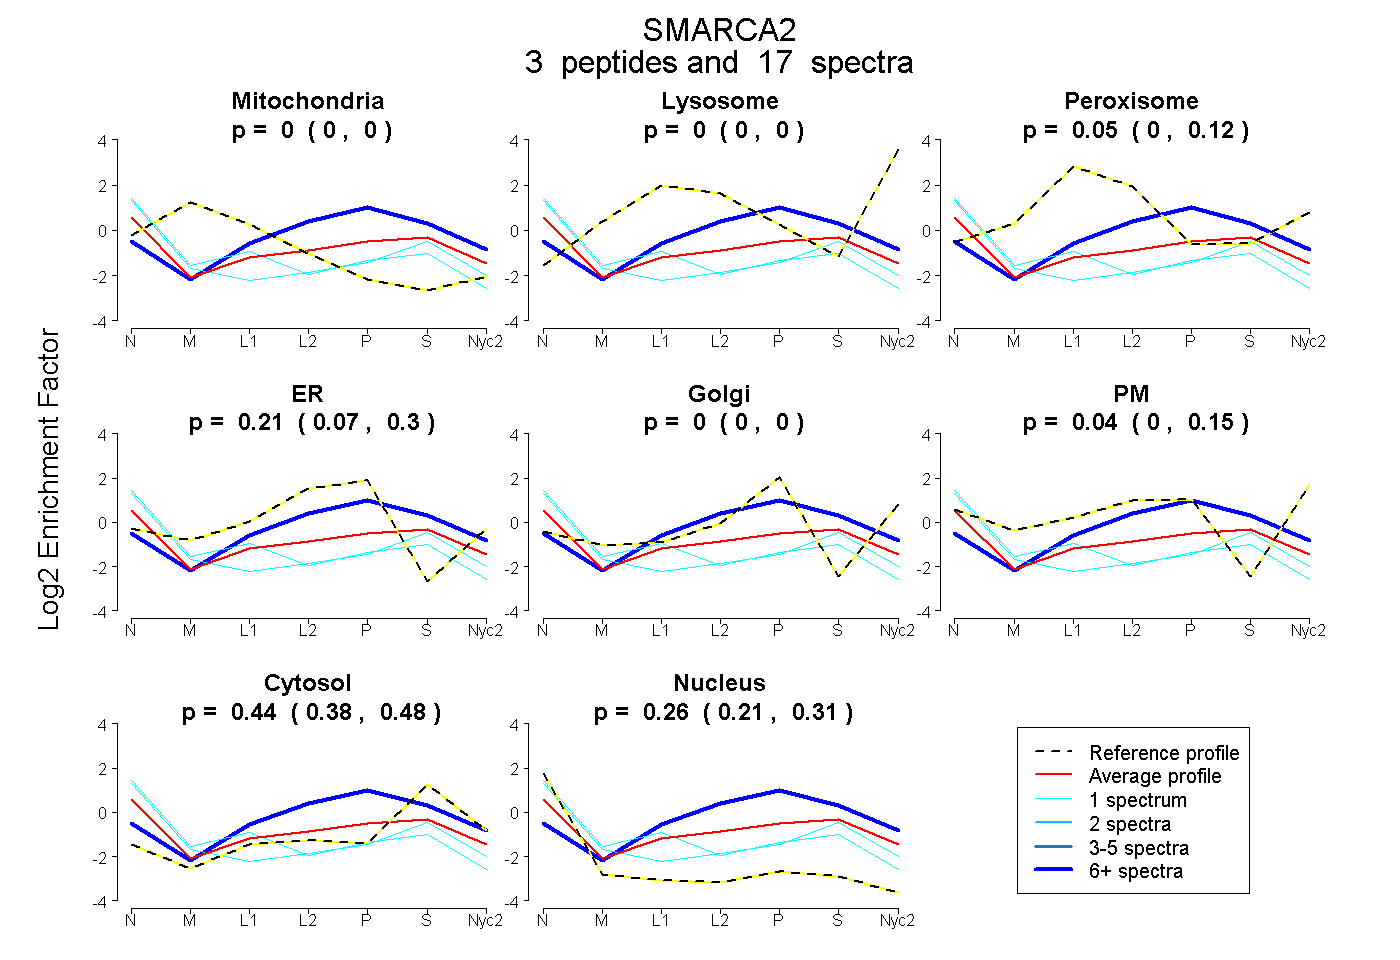
0.000 | 0.000
0.000 | 0.000
0.000 | 0.117
0.066 | 0.297
0.000 | 0.000
0.000 | 0.145
0.377 | 0.485
0.210 | 0.309
1peptide
spectra
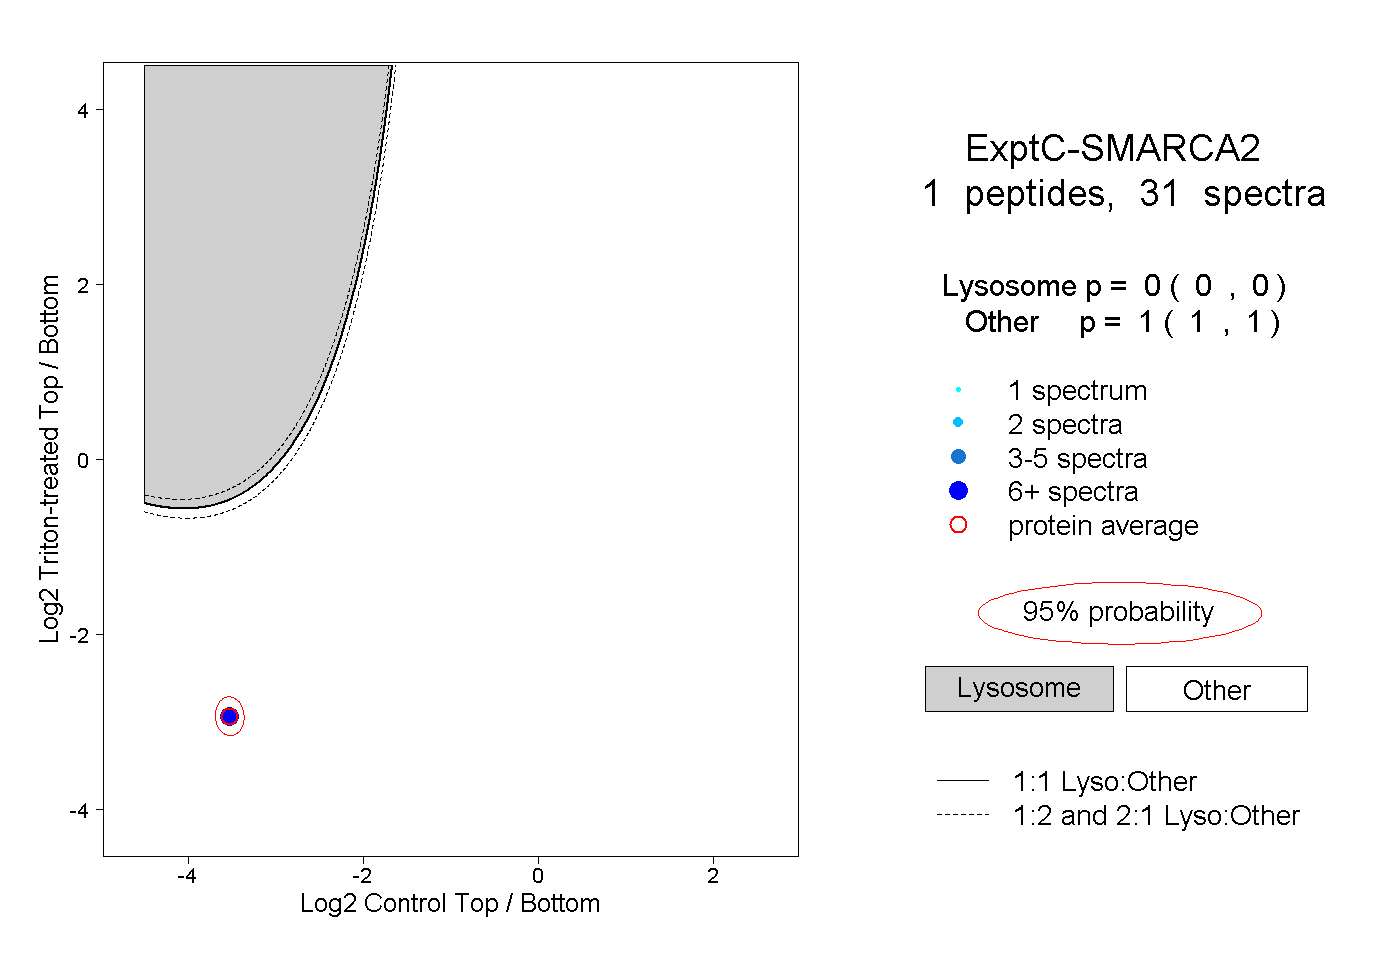
0.000 | 0.000
1.000 | 1.000
2peptides
spectra
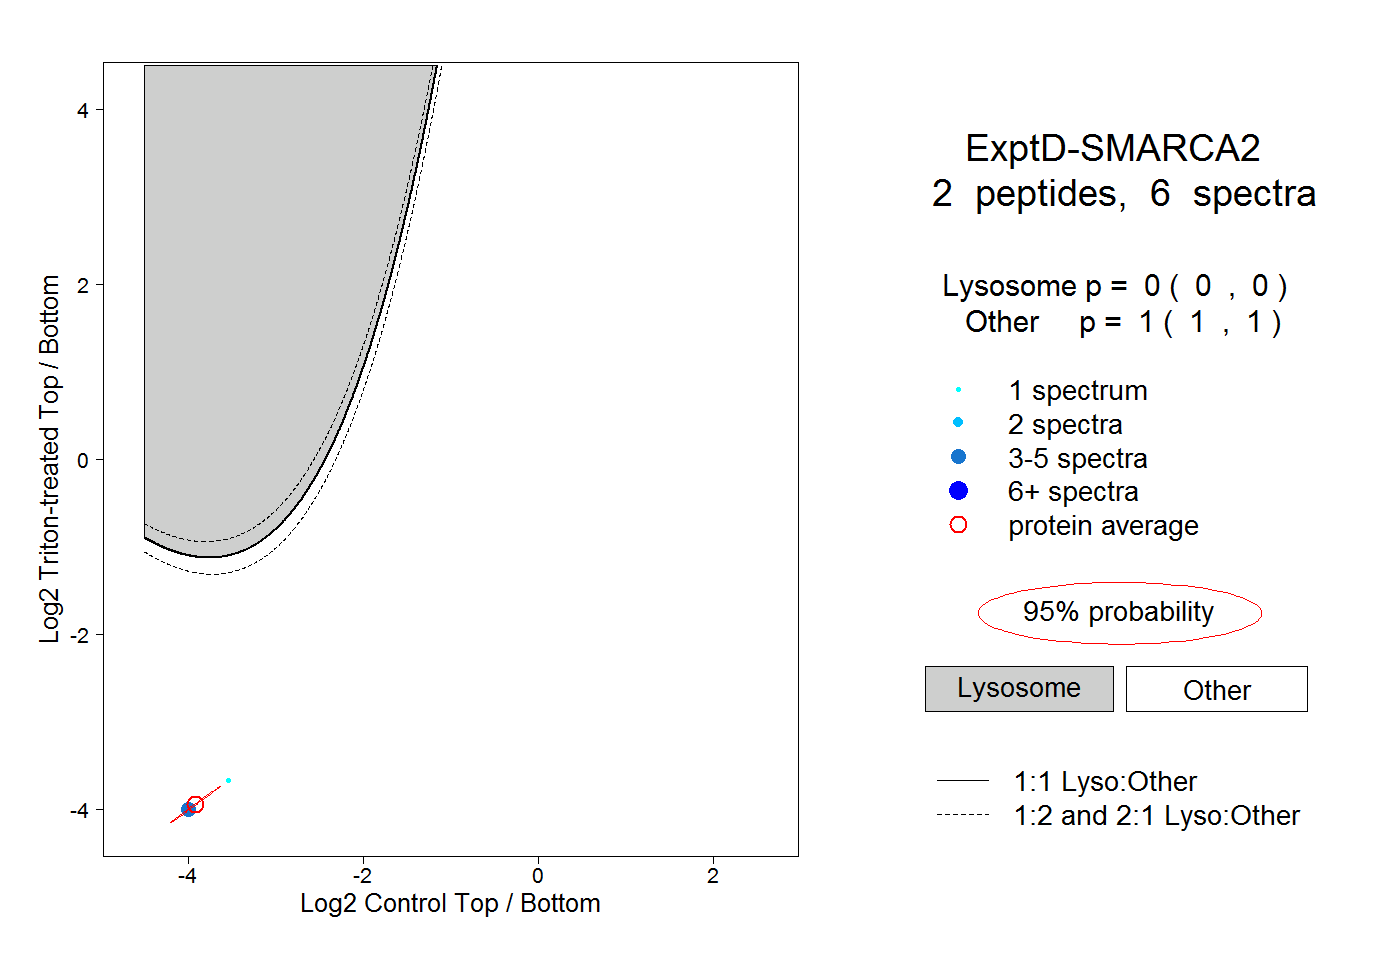
0.000 | 0.000
1.000 | 1.000