 5
5peptides
spectra
0.000 | 0.000
0.000 | 0.000
0.000 | 0.000
0.131 | 0.279
0.000 | 0.132
0.000 | 0.000
0.245 | 0.291
0.430 | 0.490
2peptides
spectra
NA | NA
NA | NA
NA | NA
NA | NA
NA | NA
NA | NA
NA | NA
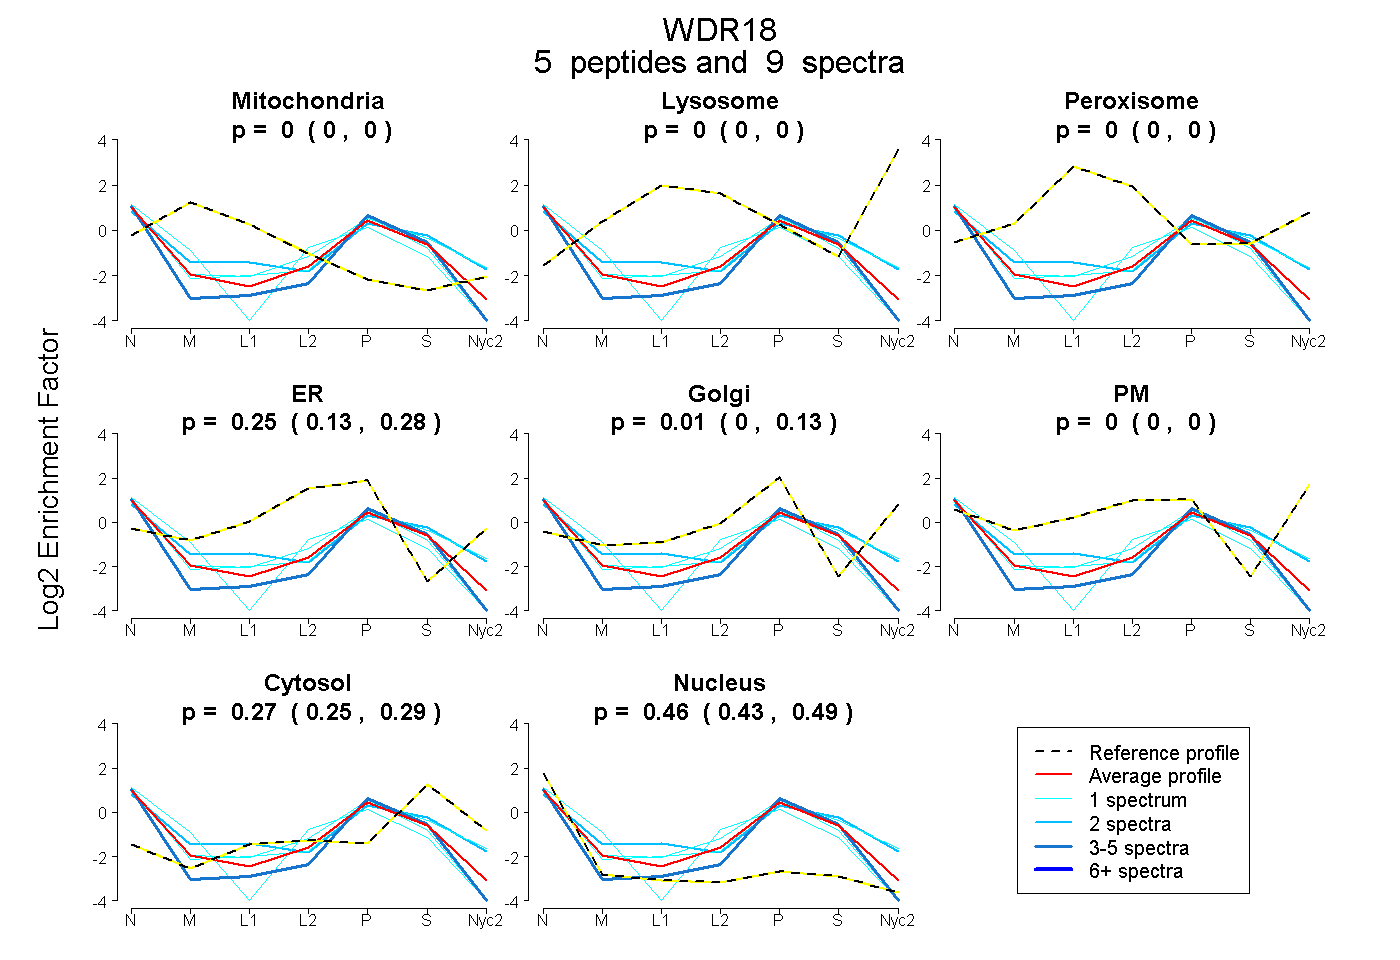
| Plot | Mito | Lyso | Perox | ER | Golgi | PM | Cytosol | Nucleus | |||||
| Expt A |
5 peptides |
9 spectra |
|
0.000 0.000 | 0.000 |
0.000 0.000 | 0.000 |
0.000 0.000 | 0.000 |
0.255 0.131 | 0.279 |
0.009 0.000 | 0.132 |
0.000 0.000 | 0.000 |
0.274 0.245 | 0.291 |
0.463 0.430 | 0.490 |
||
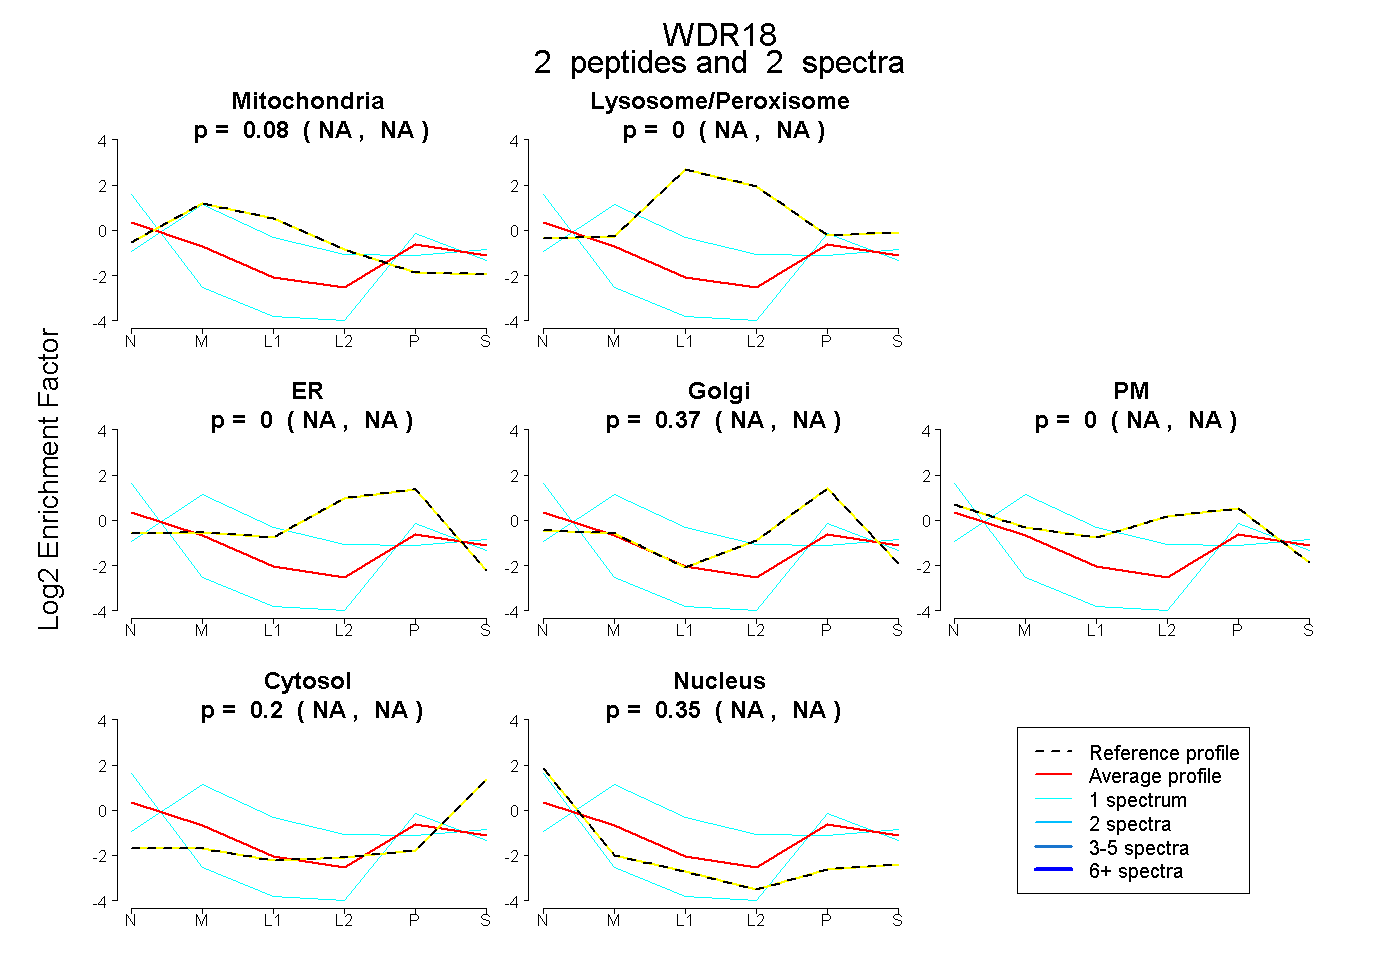
| Plot | Mito | Lyso or Perox | ER | Golgi | PM | Cytosol | Nucleus | ||||||
| Expt B |
2 peptides |
2 spectra |
|
0.082 NA | NA |
0.000 NA | NA |
0.000 NA | NA |
0.370 NA | NA |
0.000 NA | NA |
0.201 NA | NA |
0.346 NA | NA |