 2
2peptides
spectra
NA | NA
NA | NA
NA | NA
NA | NA
NA | NA
NA | NA
NA | NA
NA | NA
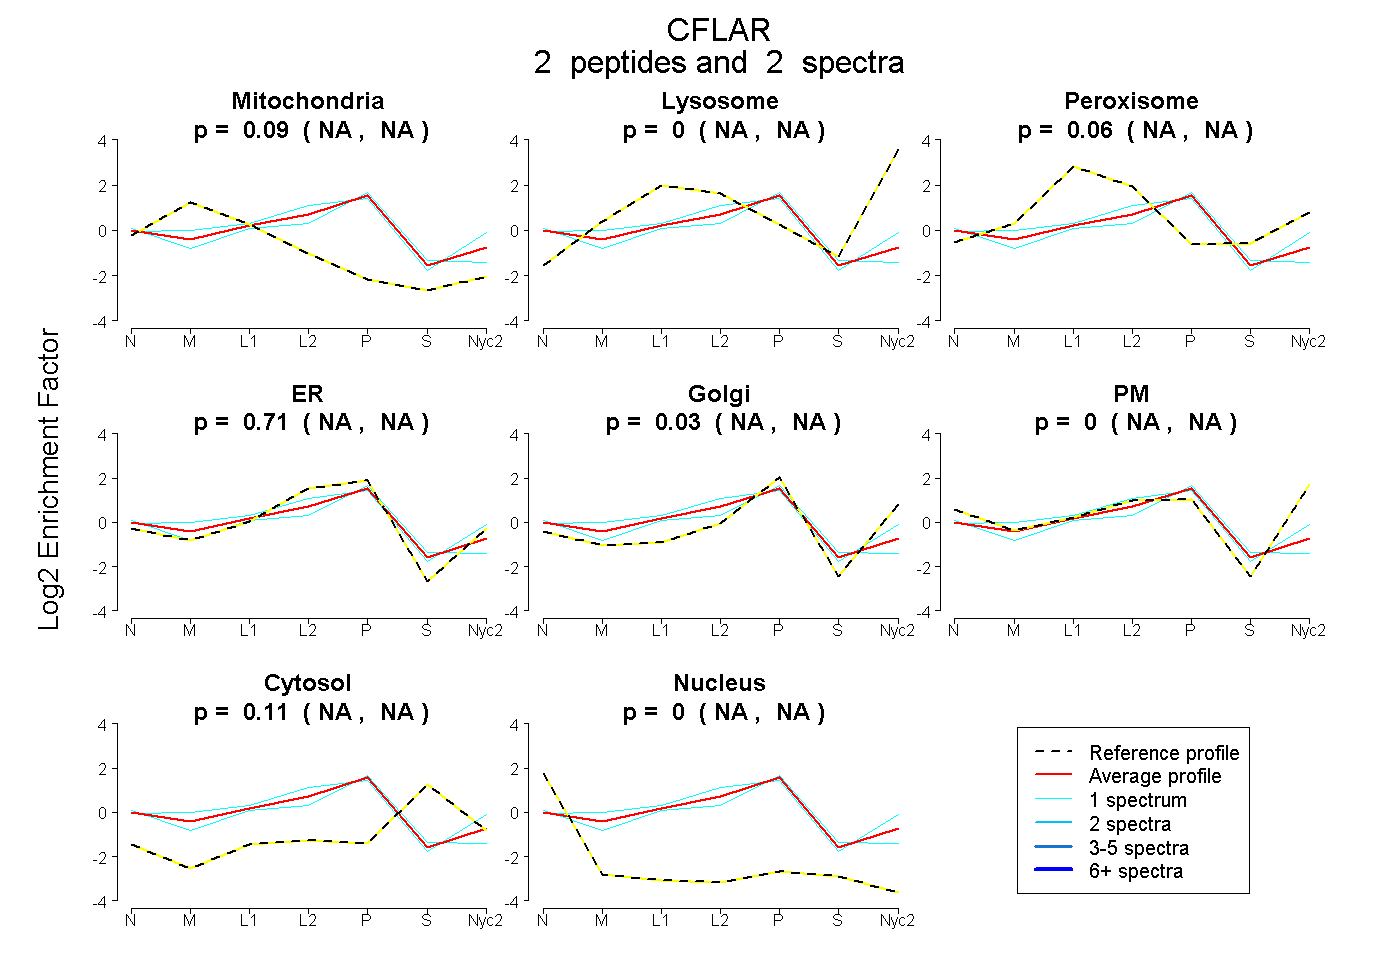
| Plot | Mito | Lyso | Perox | ER | Golgi | PM | Cytosol | Nucleus | |||||
| Expt A |
2 peptides |
2 spectra |
|
0.090 NA | NA |
0.000 NA | NA |
0.059 NA | NA |
0.713 NA | NA |
0.027 NA | NA |
0.000 NA | NA |
0.110 NA | NA |
0.000 NA | NA |
| 1 spectrum, LILSHT | 0.073 | 0.000 | 0.200 | 0.519 | 0.194 | 0.014 | 0.000 | 0.000 | ||
| 1 spectrum, DLLDCLSER | 0.055 | 0.000 | 0.000 | 0.729 | 0.000 | 0.000 | 0.169 | 0.047 |