 13
13peptides
spectra
0.000 | 0.000
0.000 | 0.000
0.000 | 0.000
0.000 | 0.000
0.000 | 0.000
0.000 | 0.000
0.964 | 0.968
0.031 | 0.036
| Plot | Mito | Lyso | Perox | ER | Golgi | PM | Cytosol | Nucleus | |||||
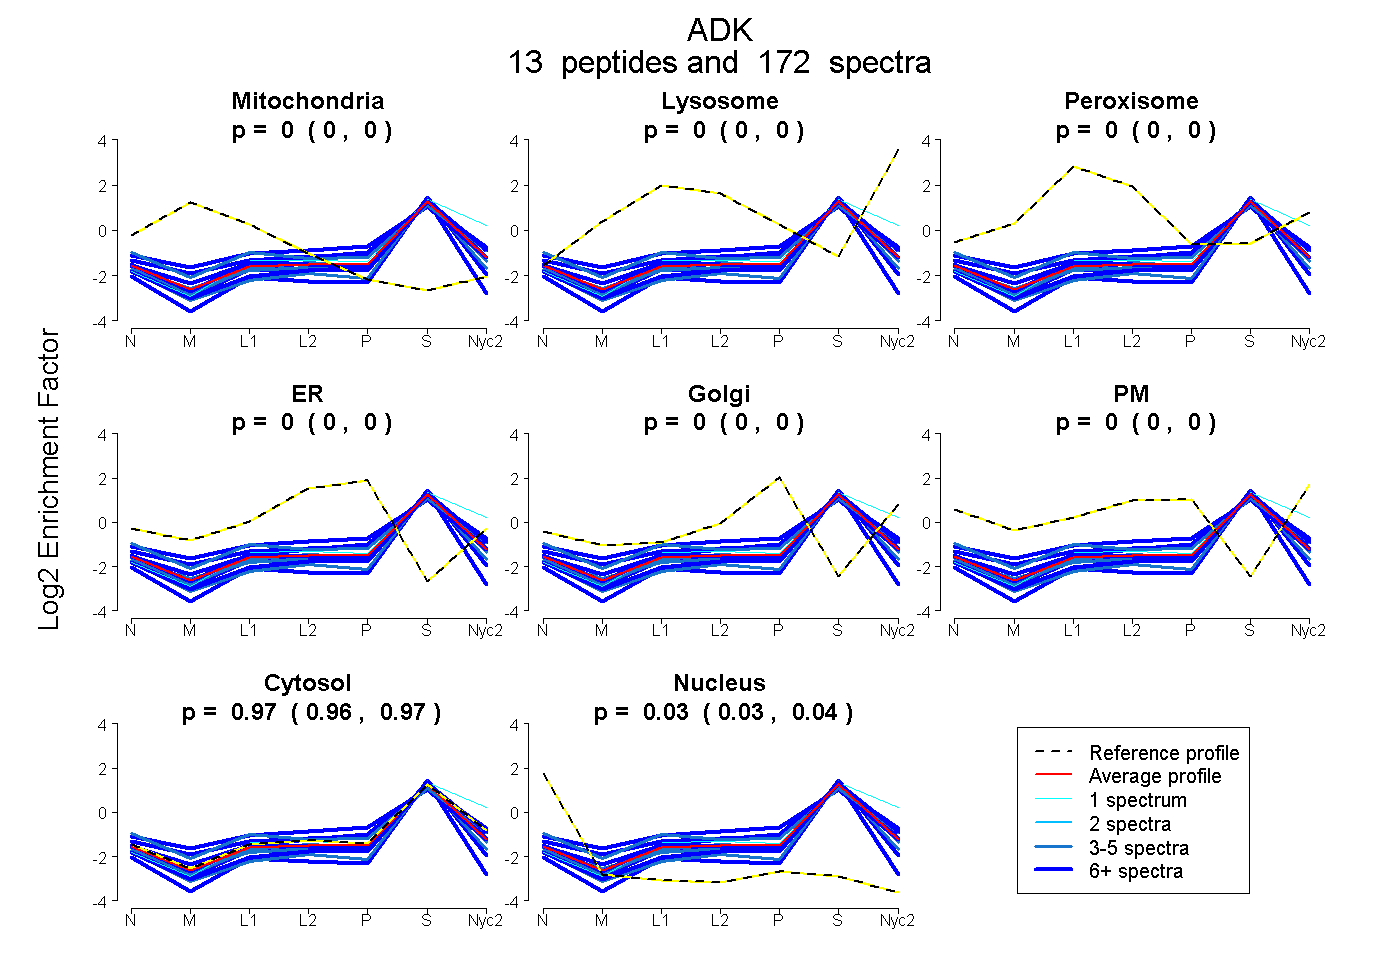
| Expt A |
13 peptides |
172 spectra |
|
0.000 0.000 | 0.000 |
0.000 0.000 | 0.000 |
0.000 0.000 | 0.000 |
0.000 0.000 | 0.000 |
0.000 0.000 | 0.000 |
0.000 0.000 | 0.000 |
0.966 0.964 | 0.968 |
0.034 0.031 | 0.036 |
| 7 spectra, AATFFGCIGIDK | 0.000 | 0.000 | 0.000 | 0.000 | 0.000 | 0.000 | 0.850 | 0.150 | ||
| 36 spectra, AGHYAASVIIR | 0.045 | 0.027 | 0.006 | 0.000 | 0.033 | 0.000 | 0.889 | 0.000 | ||
| 5 spectra, HLDLENNWMLVEK | 0.000 | 0.000 | 0.000 | 0.000 | 0.000 | 0.000 | 0.992 | 0.008 | ||
| 5 spectra, TGCTFPEKPNFH | 0.000 | 0.000 | 0.000 | 0.000 | 0.000 | 0.000 | 0.936 | 0.064 | ||
| 10 spectra, SLVANLAAANCYK | 0.000 | 0.000 | 0.000 | 0.000 | 0.062 | 0.000 | 0.938 | 0.000 | ||
| 32 spectra, TVIFTQGR | 0.000 | 0.000 | 0.000 | 0.000 | 0.000 | 0.000 | 0.957 | 0.043 | ||
| 4 spectra, VEYHAGGSTQNSMK | 0.021 | 0.000 | 0.088 | 0.000 | 0.000 | 0.000 | 0.856 | 0.034 | ||
| 21 spectra, VAQWMIQEPHR | 0.063 | 0.000 | 0.035 | 0.098 | 0.000 | 0.000 | 0.803 | 0.000 | ||
| 14 spectra, ELFDELVK | 0.000 | 0.000 | 0.000 | 0.000 | 0.000 | 0.000 | 0.893 | 0.107 | ||
| 3 spectra, FGEILK | 0.000 | 0.000 | 0.000 | 0.000 | 0.000 | 0.000 | 0.922 | 0.078 | ||
| 18 spectra, EQGFETK | 0.000 | 0.000 | 0.000 | 0.000 | 0.000 | 0.000 | 0.989 | 0.011 | ||
| 16 spectra, YAAENNR | 0.000 | 0.000 | 0.000 | 0.000 | 0.000 | 0.000 | 0.987 | 0.013 | ||
| 1 spectrum, TVLFTNAR | 0.000 | 0.061 | 0.000 | 0.000 | 0.000 | 0.000 | 0.939 | 0.000 |
| Plot | Mito | Lyso or Perox | ER | Golgi | PM | Cytosol | Nucleus | ||||||
| Expt B |
11 peptides |
76 spectra |
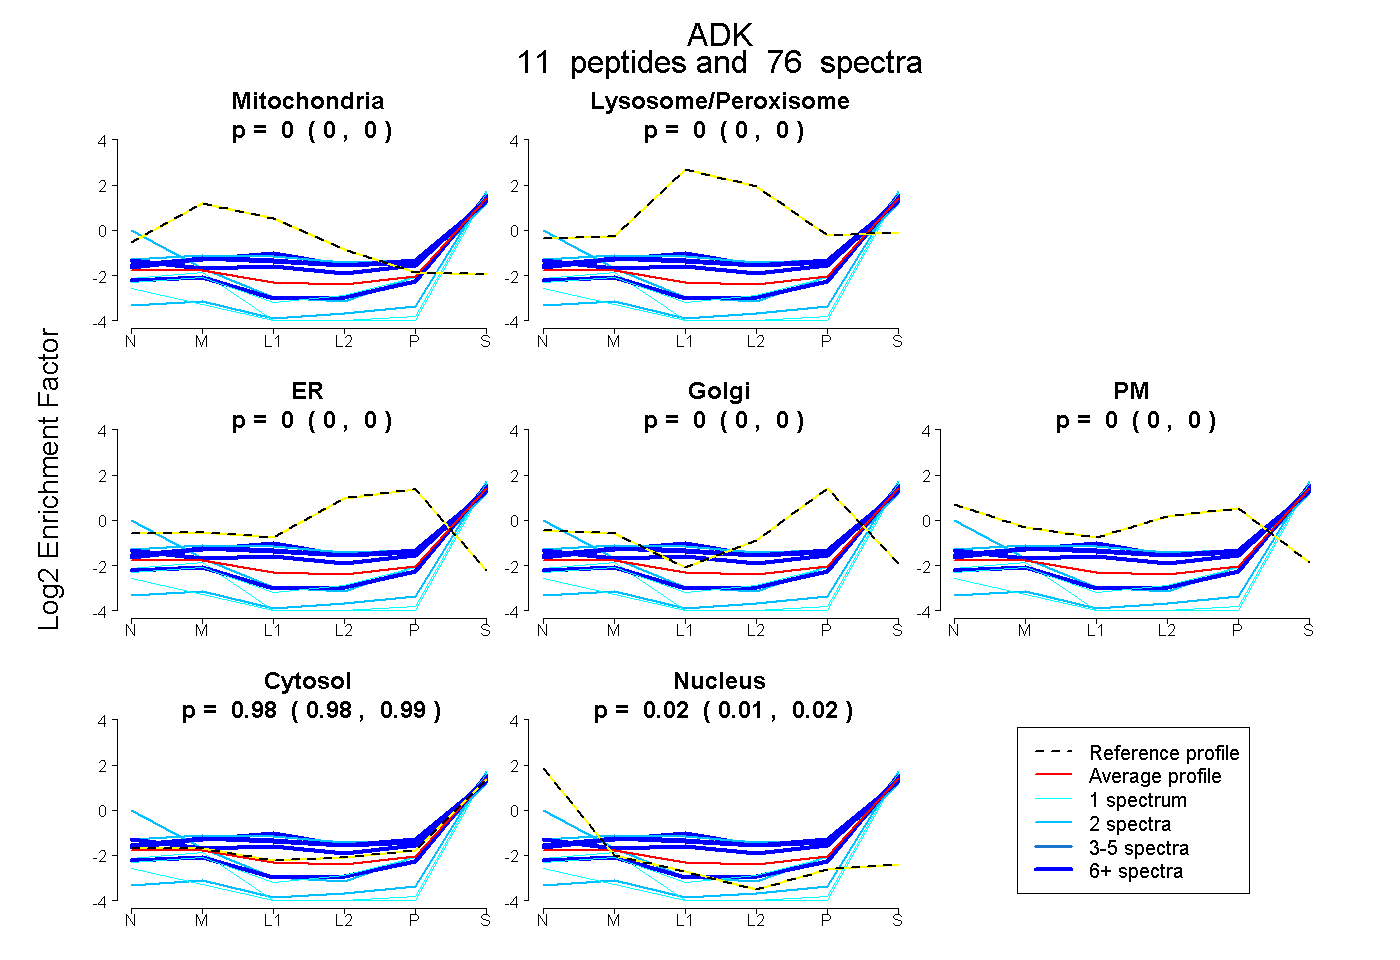 |
0.000 0.000 | 0.000 |
0.000 0.000 | 0.000 |
0.000 0.000 | 0.000 |
0.000 0.000 | 0.000 |
0.000 0.000 | 0.000 |
0.984 0.978 | 0.991 |
0.016 0.008 | 0.021 |
|||
| Plot | Lyso | Other | |||||||||||
| Expt C |
14 peptides |
117 spectra |
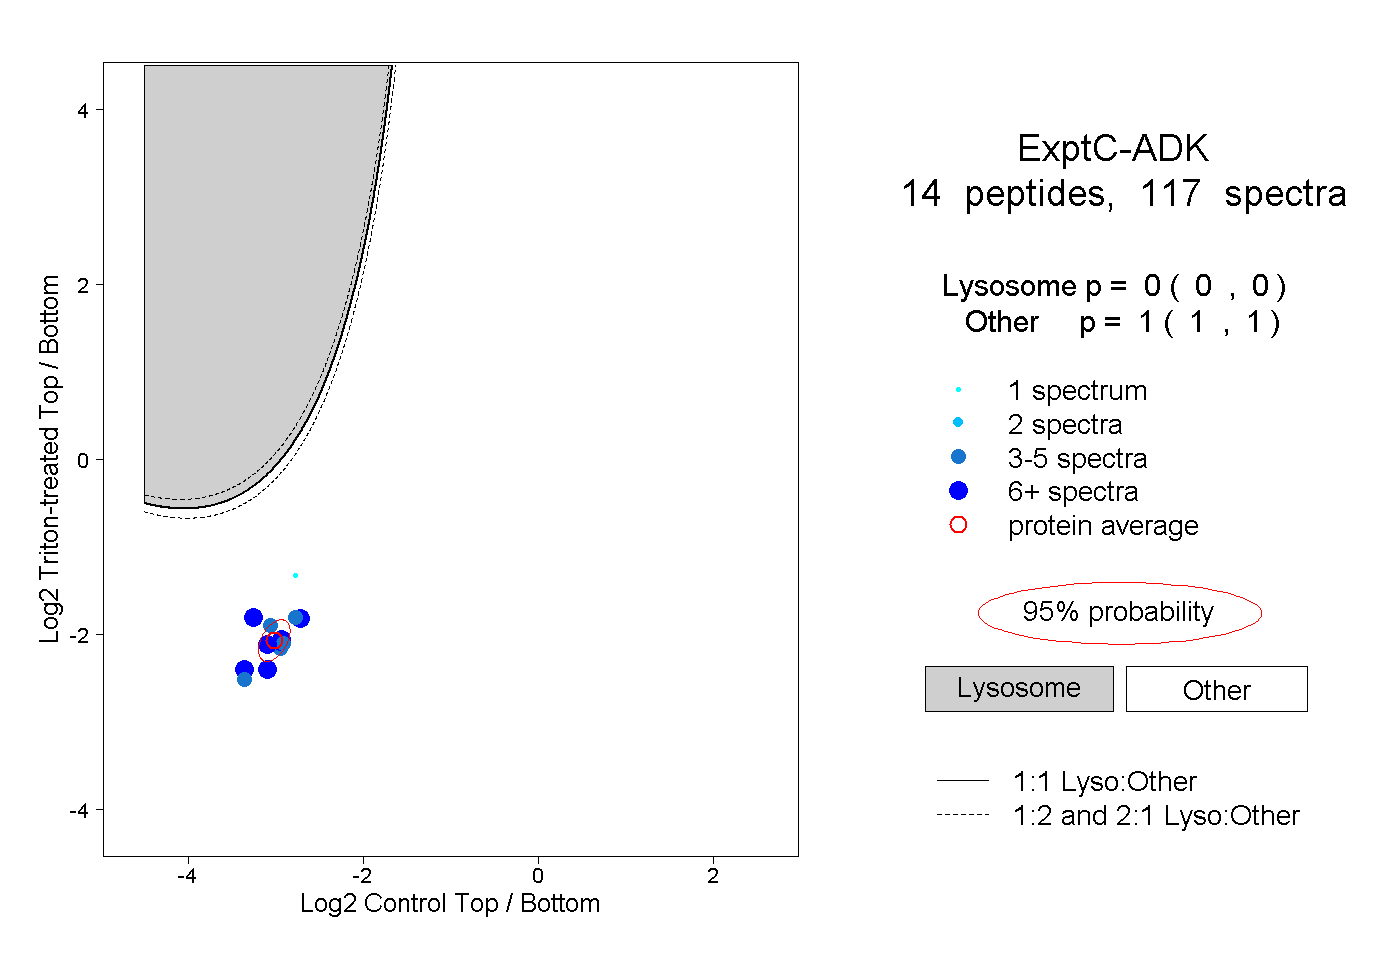 |
0.000 0.000 | 0.000 |
1.000 1.000 | 1.000 |
||||||||
| Plot | Lyso | Other | |||||||||||
| Expt D |
4 peptides |
7 spectra |
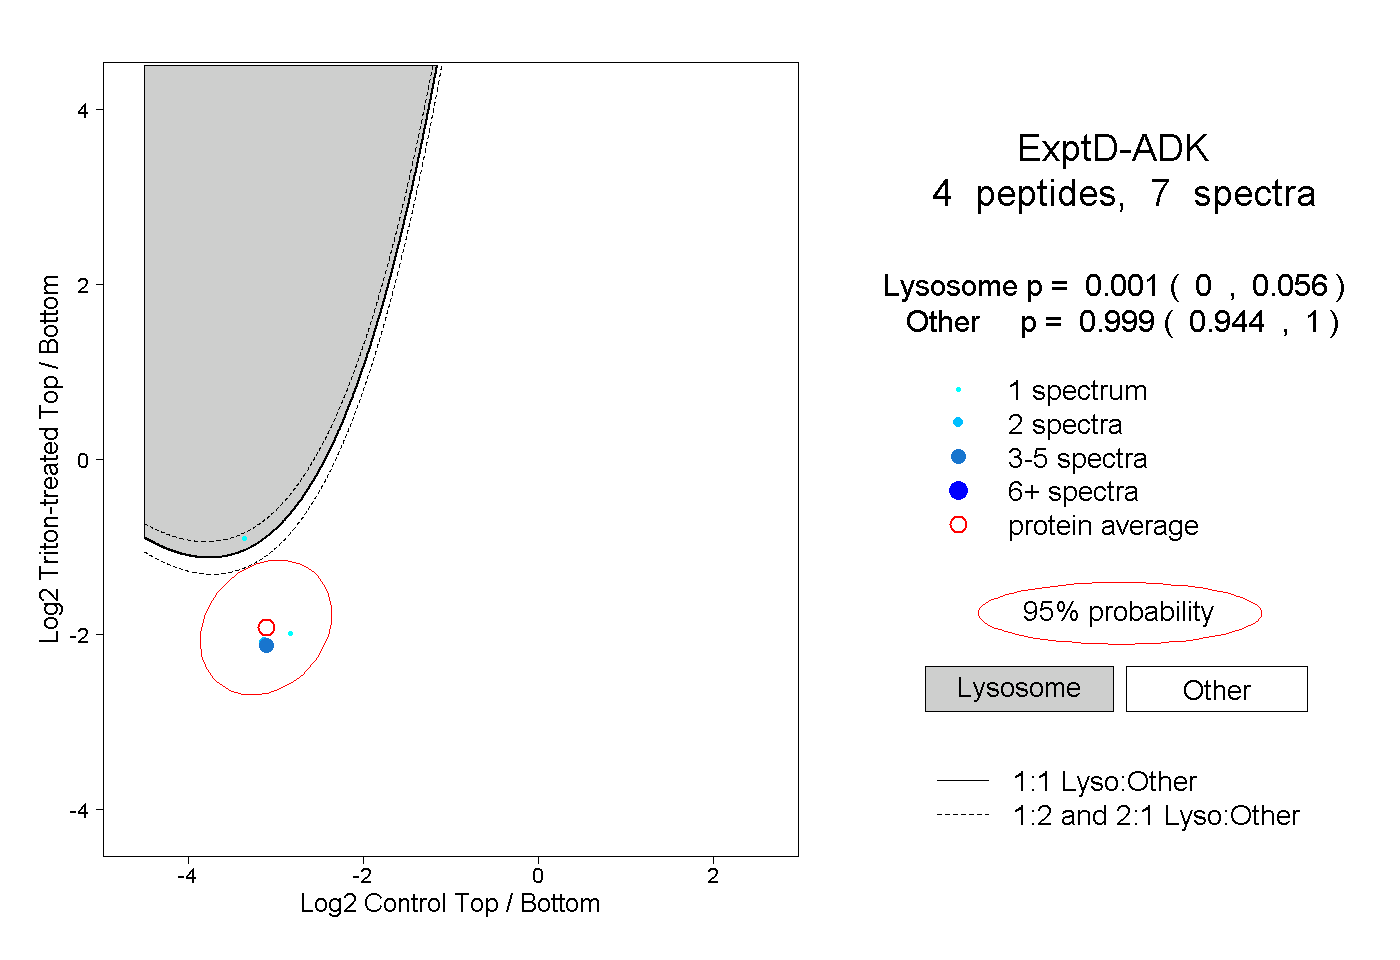 |
0.001 0.000 | 0.056 |
0.999 0.944 | 1.000 |