 2
2peptides
spectra
0.000 | 0.000
0.000 | 0.051
0.000 | 0.088
0.000 | 0.091
0.000 | 0.053
0.000 | 0.000
0.841 | 0.910
0.000 | 0.000
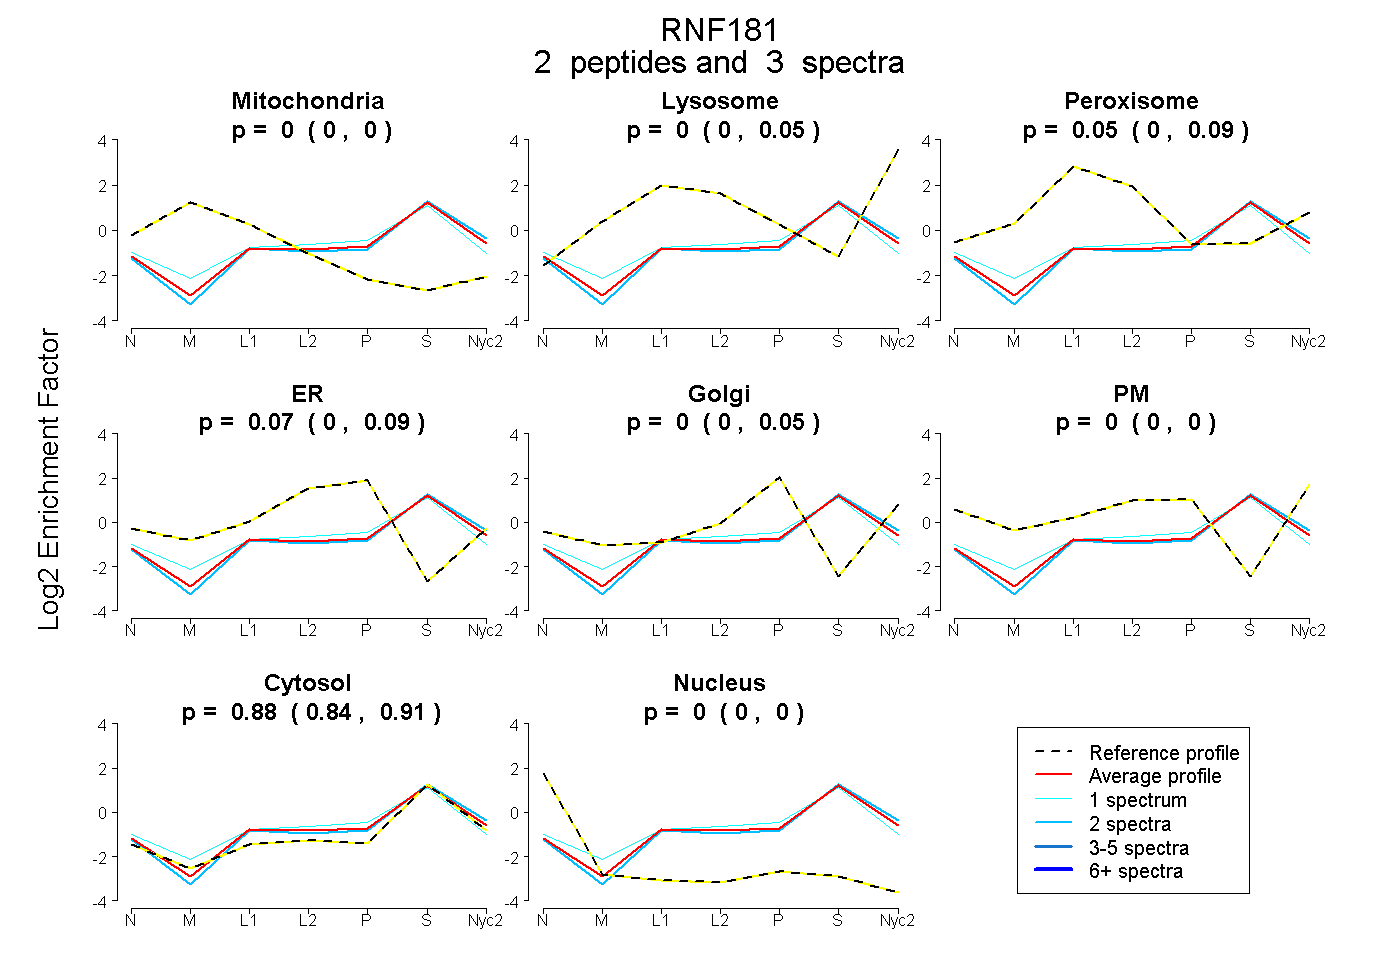
| Plot | Mito | Lyso | Perox | ER | Golgi | PM | Cytosol | Nucleus | |||||
| Expt A |
2 peptides |
3 spectra |
|
0.000 0.000 | 0.000 |
0.000 0.000 | 0.051 |
0.052 0.000 | 0.088 |
0.068 0.000 | 0.091 |
0.000 0.000 | 0.053 |
0.000 0.000 | 0.000 |
0.880 0.841 | 0.910 |
0.000 0.000 | 0.000 |
| 1 spectrum, ASYFDEHDCEPLNPER | 0.000 | 0.000 | 0.068 | 0.131 | 0.000 | 0.000 | 0.801 | 0.000 | ||
| 2 spectra, GAWSWAPGSR | 0.000 | 0.054 | 0.000 | 0.023 | 0.000 | 0.000 | 0.922 | 0.000 |