 2
2peptides
spectra
NA | NA
NA | NA
NA | NA
NA | NA
NA | NA
NA | NA
NA | NA
NA | NA
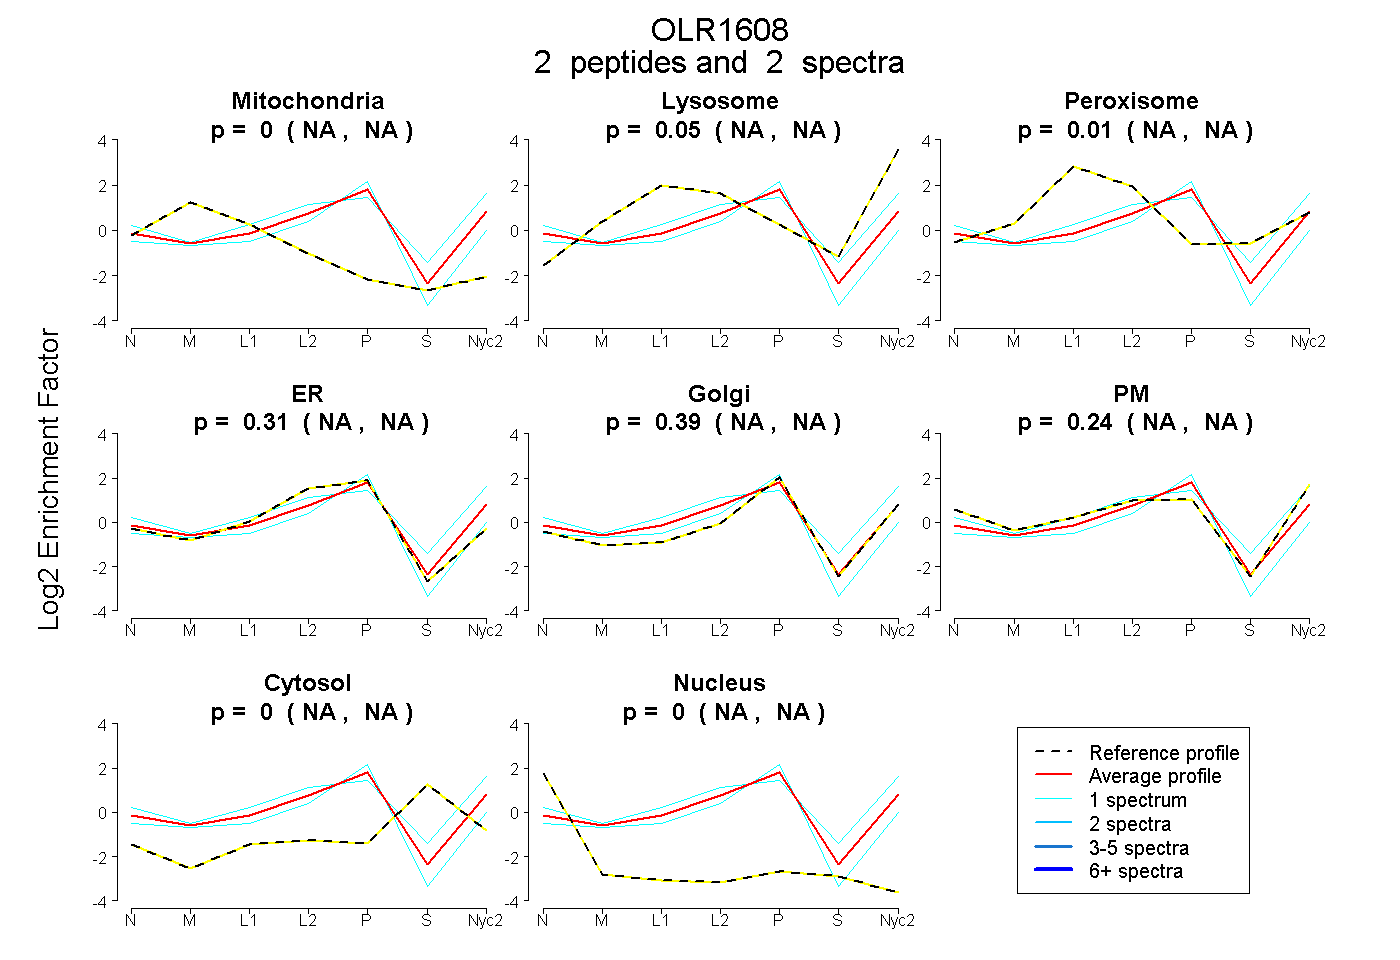
| Plot | Mito | Lyso | Perox | ER | Golgi | PM | Cytosol | Nucleus | |||||
| Expt A |
2 peptides |
2 spectra |
|
0.000 NA | NA |
0.048 NA | NA |
0.005 NA | NA |
0.310 NA | NA |
0.392 NA | NA |
0.244 NA | NA |
0.000 NA | NA |
0.000 NA | NA |
| 1 spectrum, MIIDYLTDHK | 0.000 | 0.161 | 0.000 | 0.113 | 0.074 | 0.588 | 0.064 | 0.000 | ||
| 1 spectrum, YINTLTRPR | 0.032 | 0.000 | 0.000 | 0.440 | 0.525 | 0.000 | 0.000 | 0.003 |