 1
1peptide
spectra
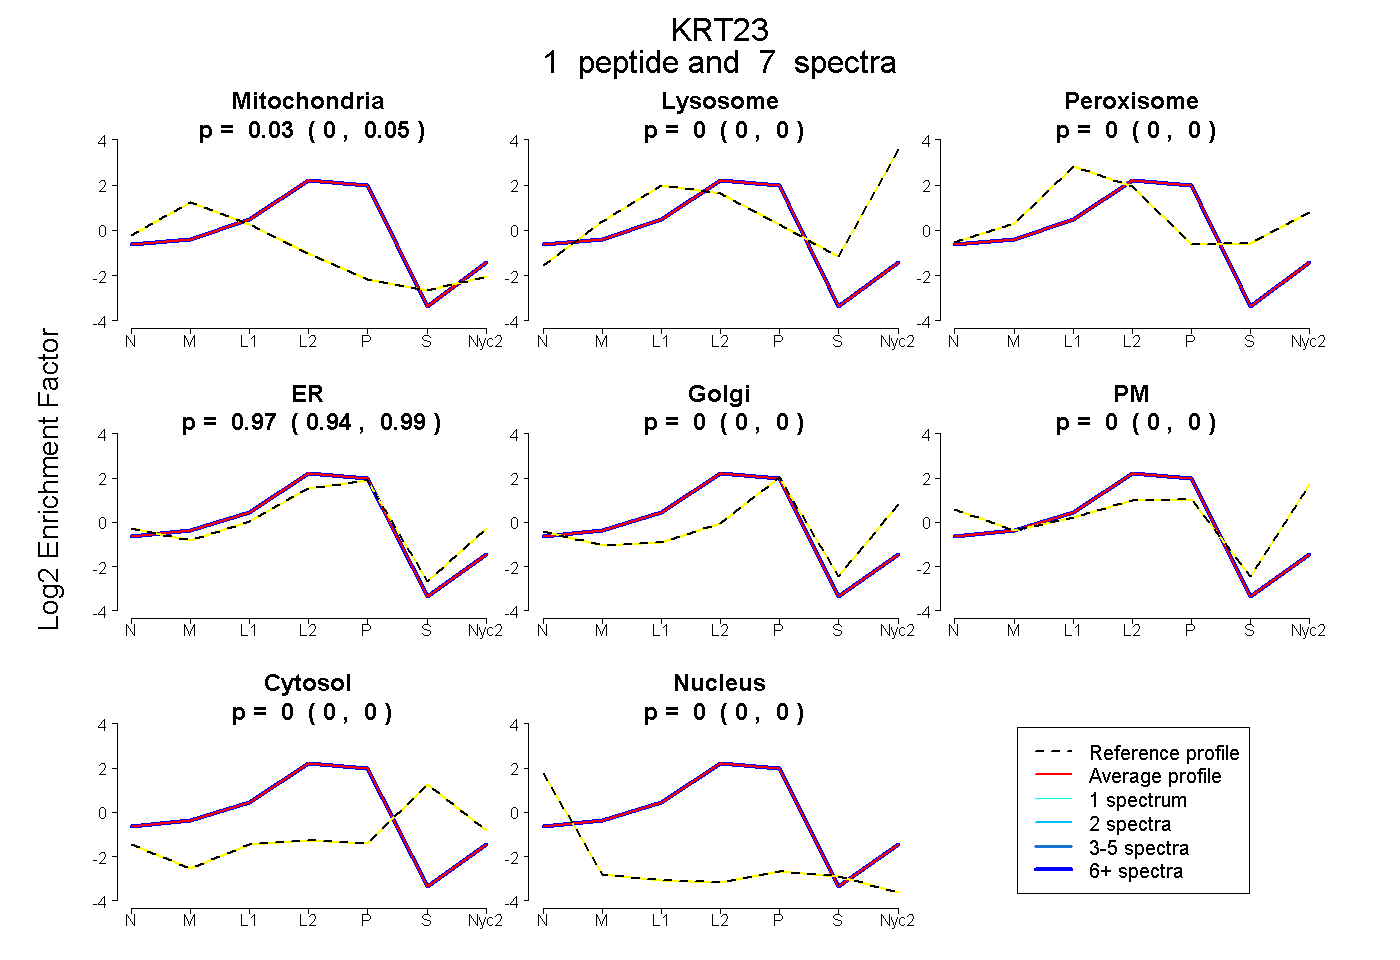
0.004 | 0.055
0.000 | 0.000
0.000 | 0.000
0.942 | 0.992
0.000 | 0.000
0.000 | 0.000
0.000 | 0.000
0.000 | 0.000
1peptide
spectra
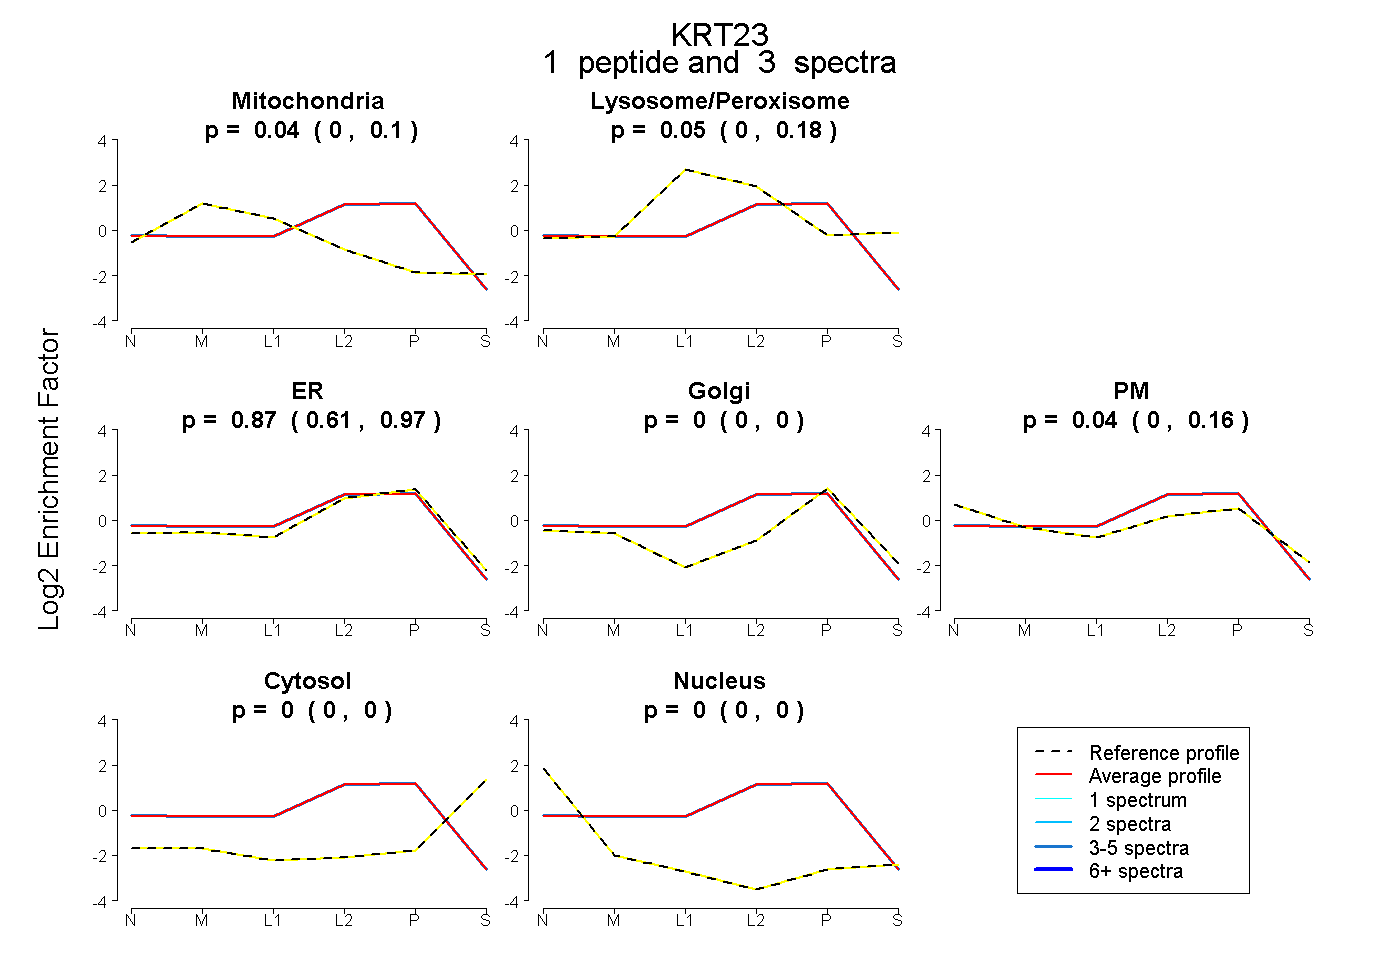
0.000 | 0.104
0.000 | 0.176
0.606 | 0.971
0.000 | 0.000
0.000 | 0.165
0.000 | 0.000
0.000 | 0.000
1peptide
spectra
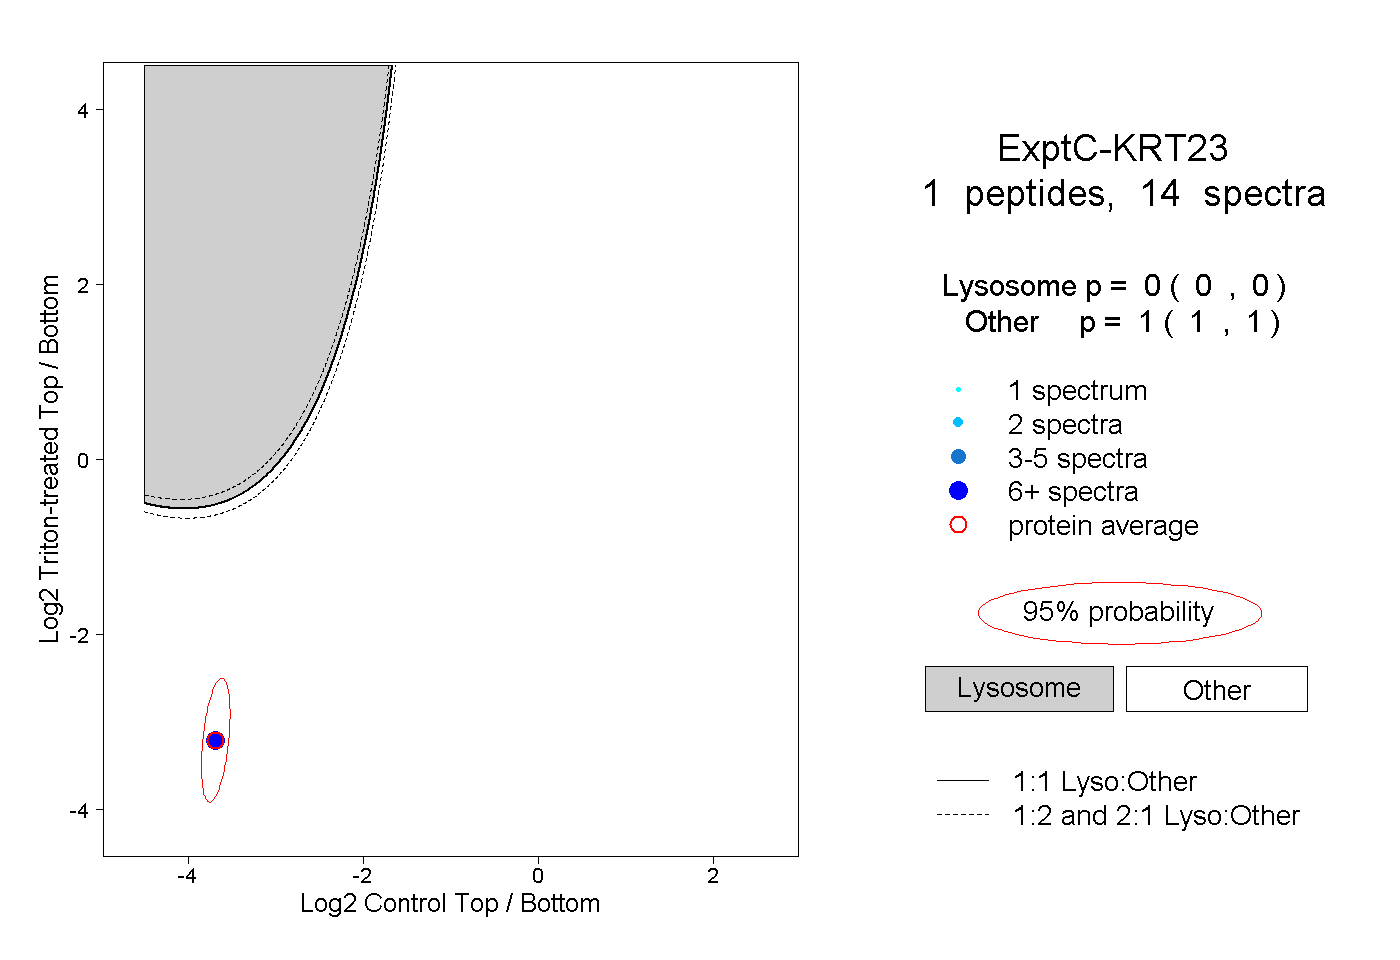
0.000 | 0.000
1.000 | 1.000
1peptide
spectra

0.000 | 0.000
1.000 | 1.000