 3
3peptides
spectra
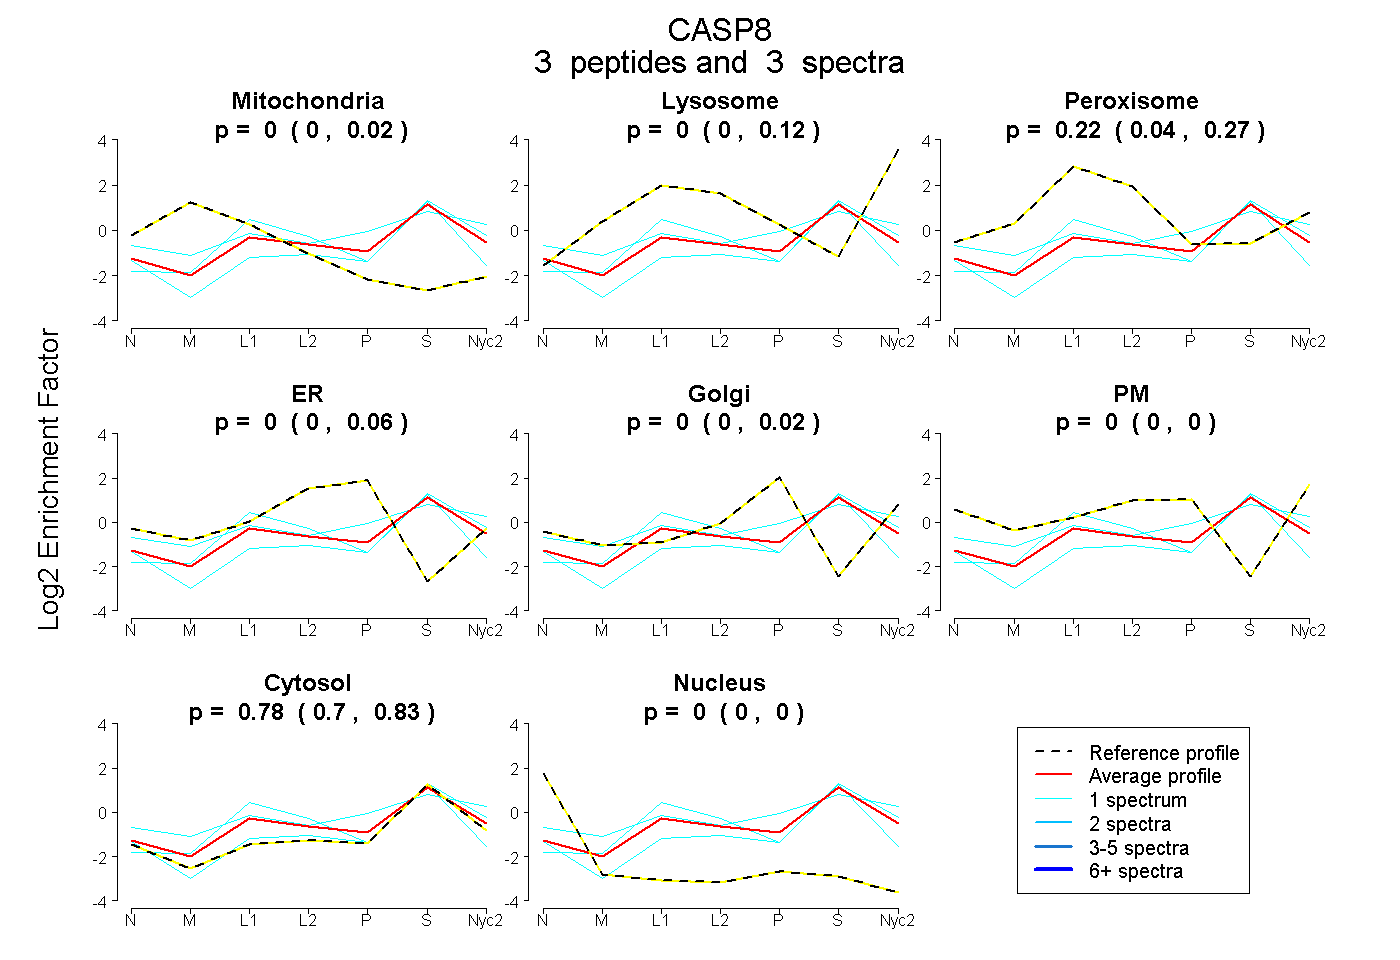
0.000 | 0.018
0.000 | 0.118
0.043 | 0.271
0.000 | 0.061
0.000 | 0.023
0.000 | 0.000
0.700 | 0.834
0.000 | 0.000
1peptide
spectrum
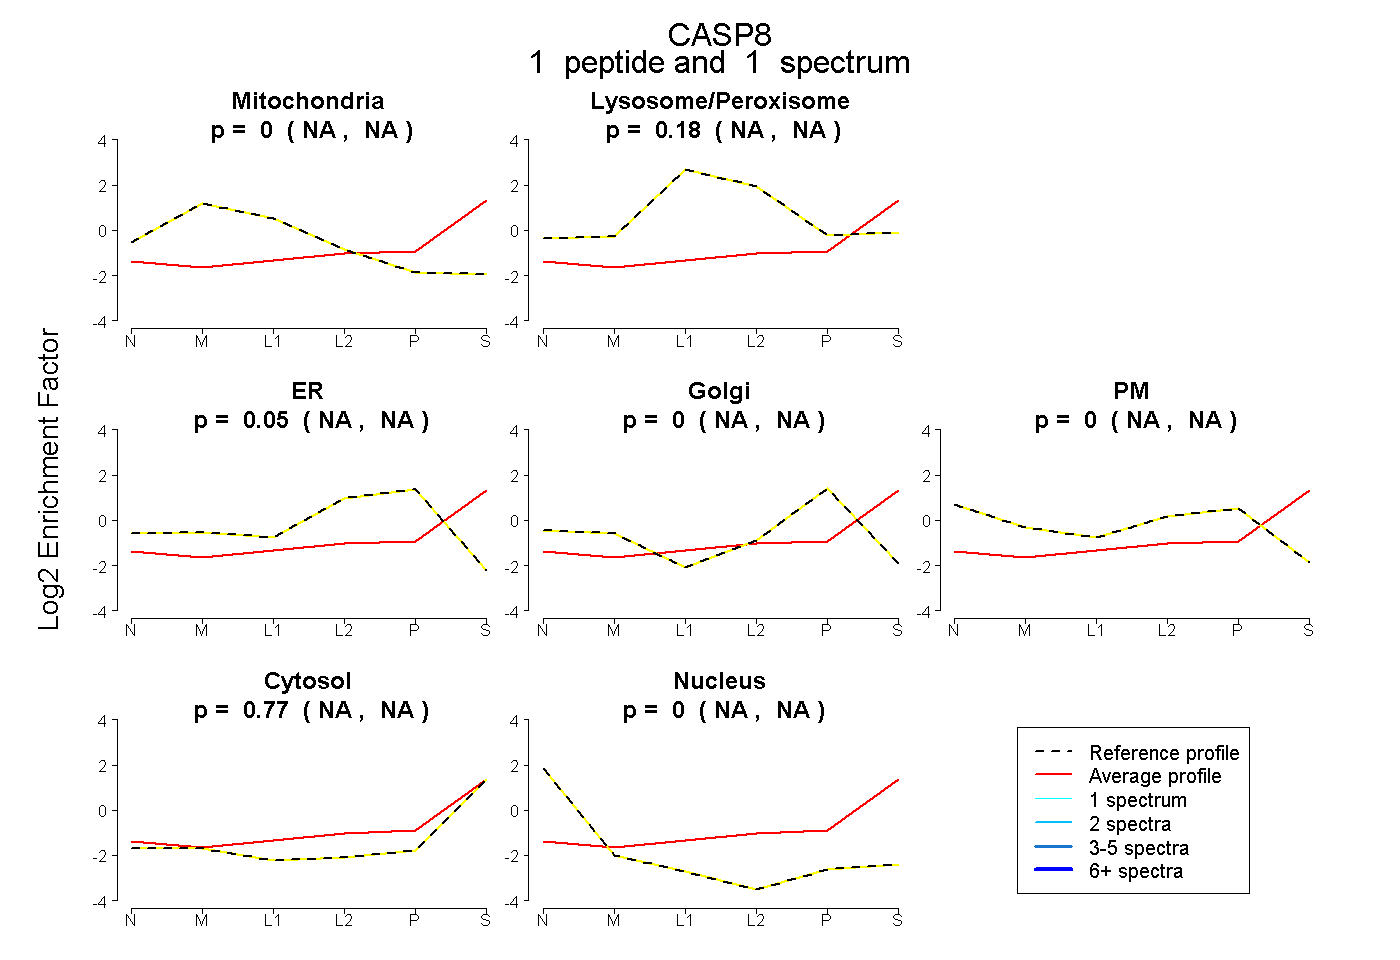
NA | NA
NA | NA
NA | NA
NA | NA
NA | NA
NA | NA
NA | NA
1peptide
spectra
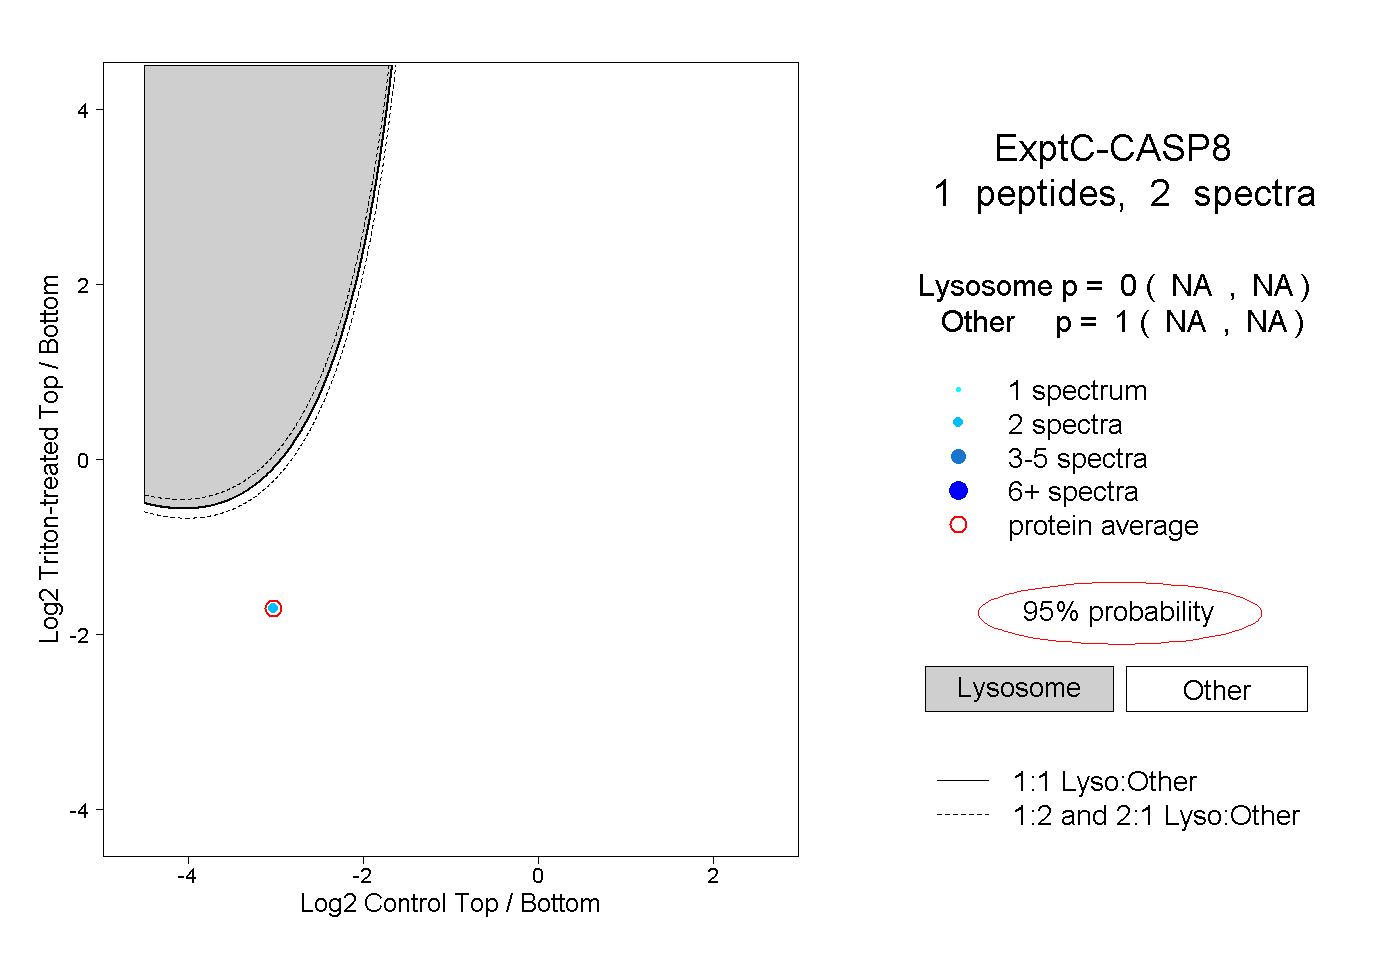
NA | NA
NA | NA