 9
9peptides
spectra
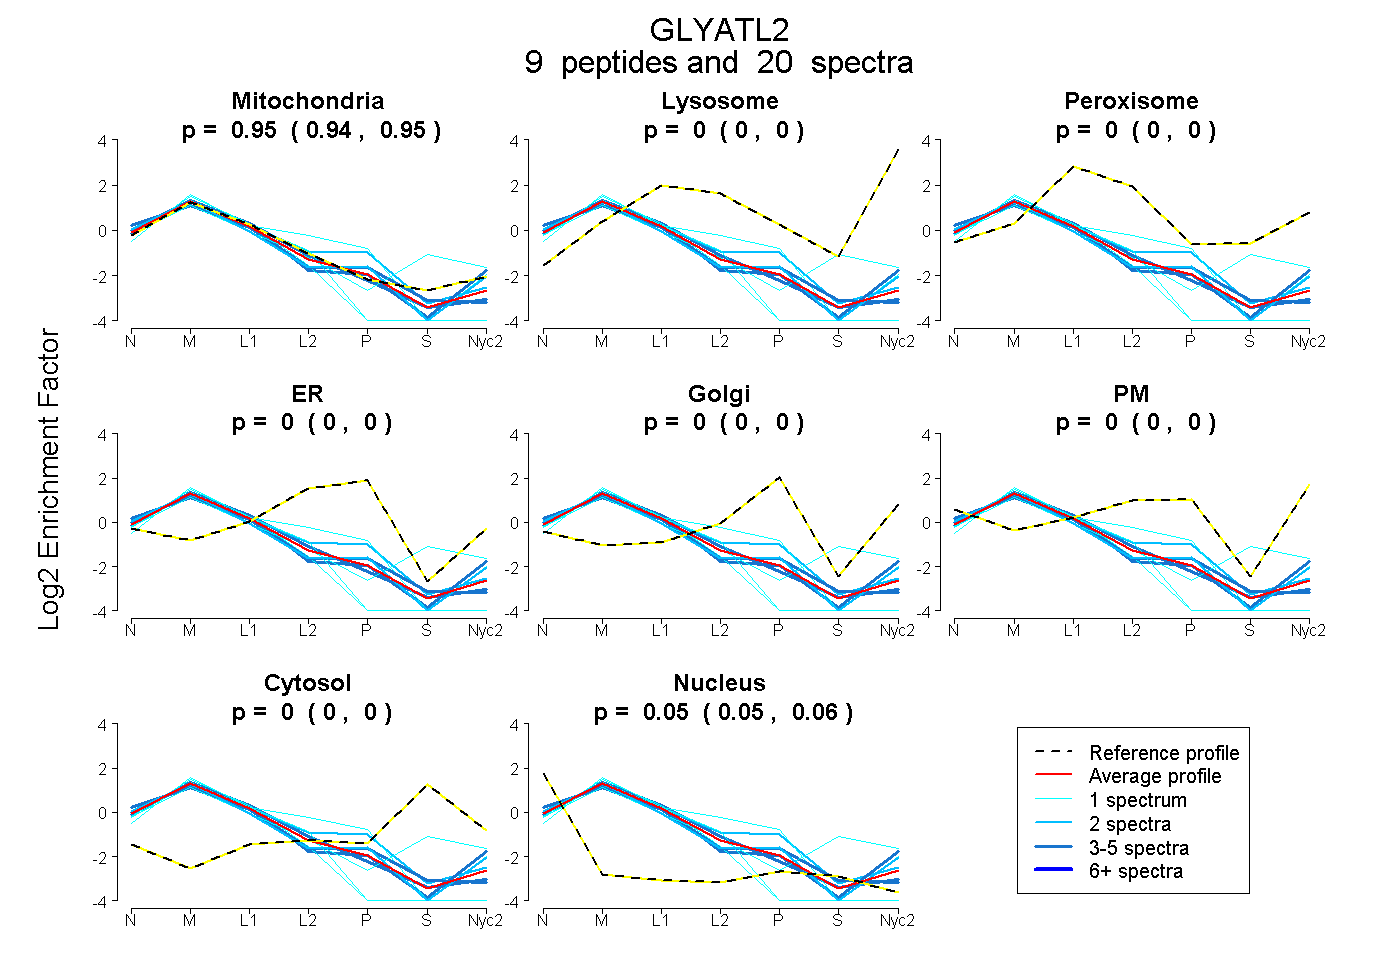
0.941 | 0.953
0.000 | 0.000
0.000 | 0.000
0.000 | 0.000
0.000 | 0.000
0.000 | 0.000
0.000 | 0.000
0.045 | 0.058
6peptides
spectra
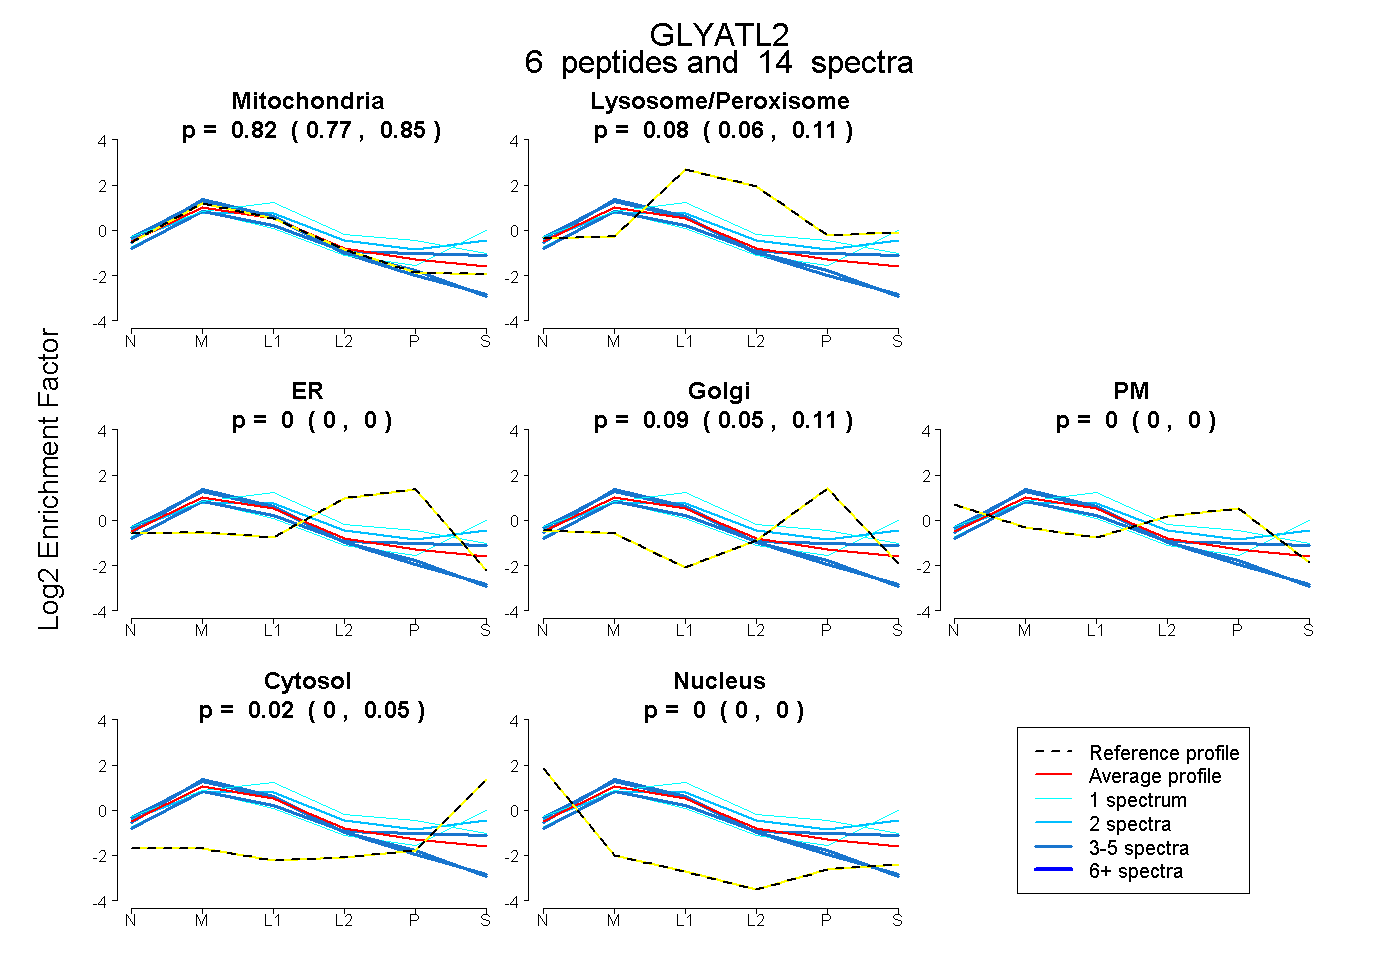
0.771 | 0.850
0.055 | 0.107
0.000 | 0.000
0.047 | 0.110
0.000 | 0.000
0.000 | 0.052
0.000 | 0.000
10peptides
spectra
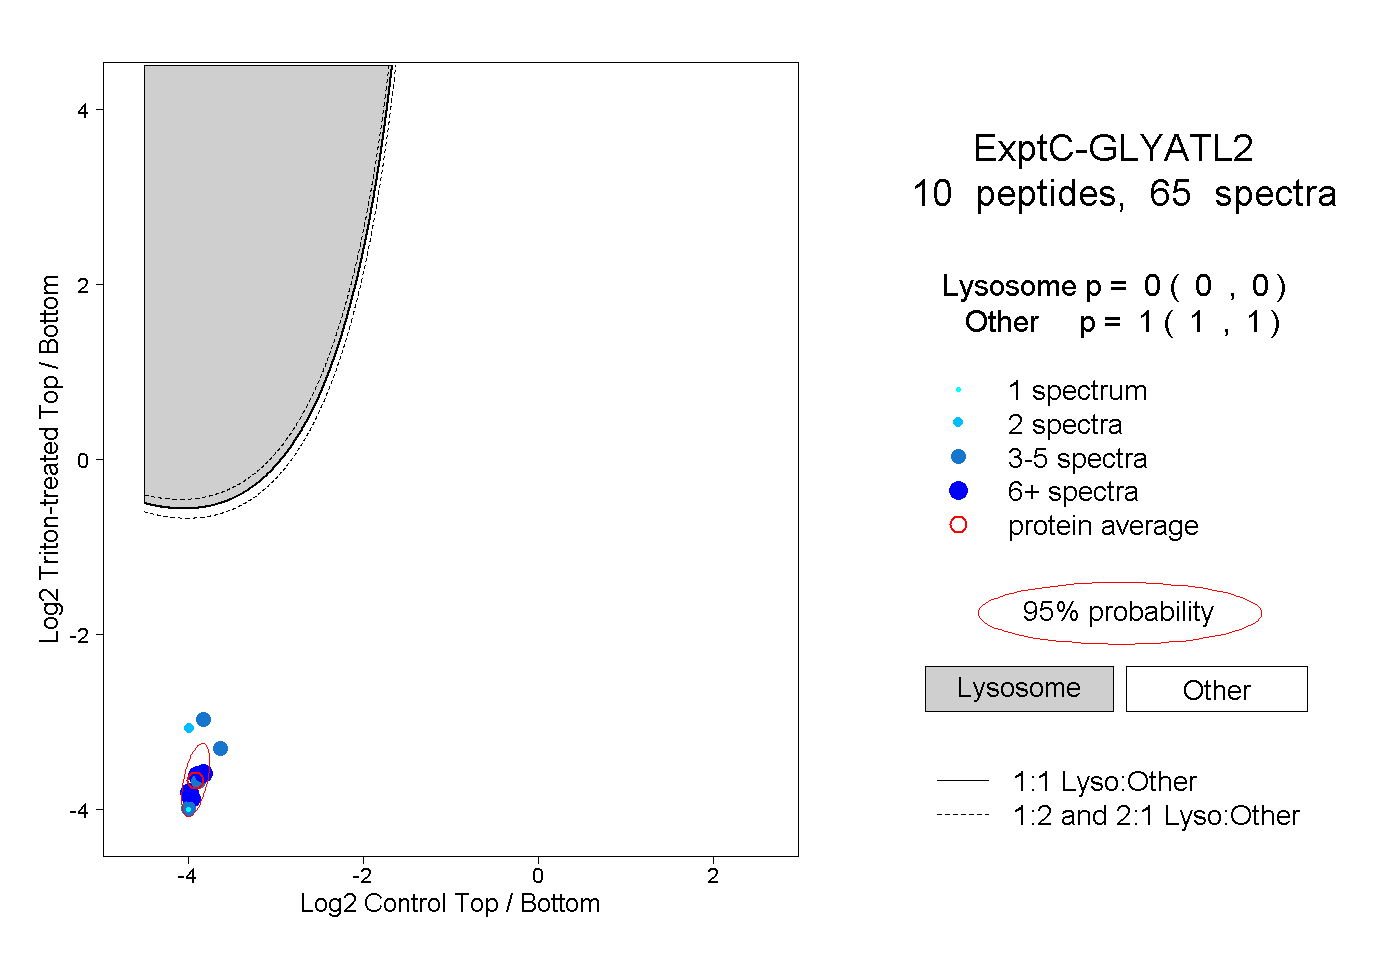
0.000 | 0.000
1.000 | 1.000
3peptides
spectra
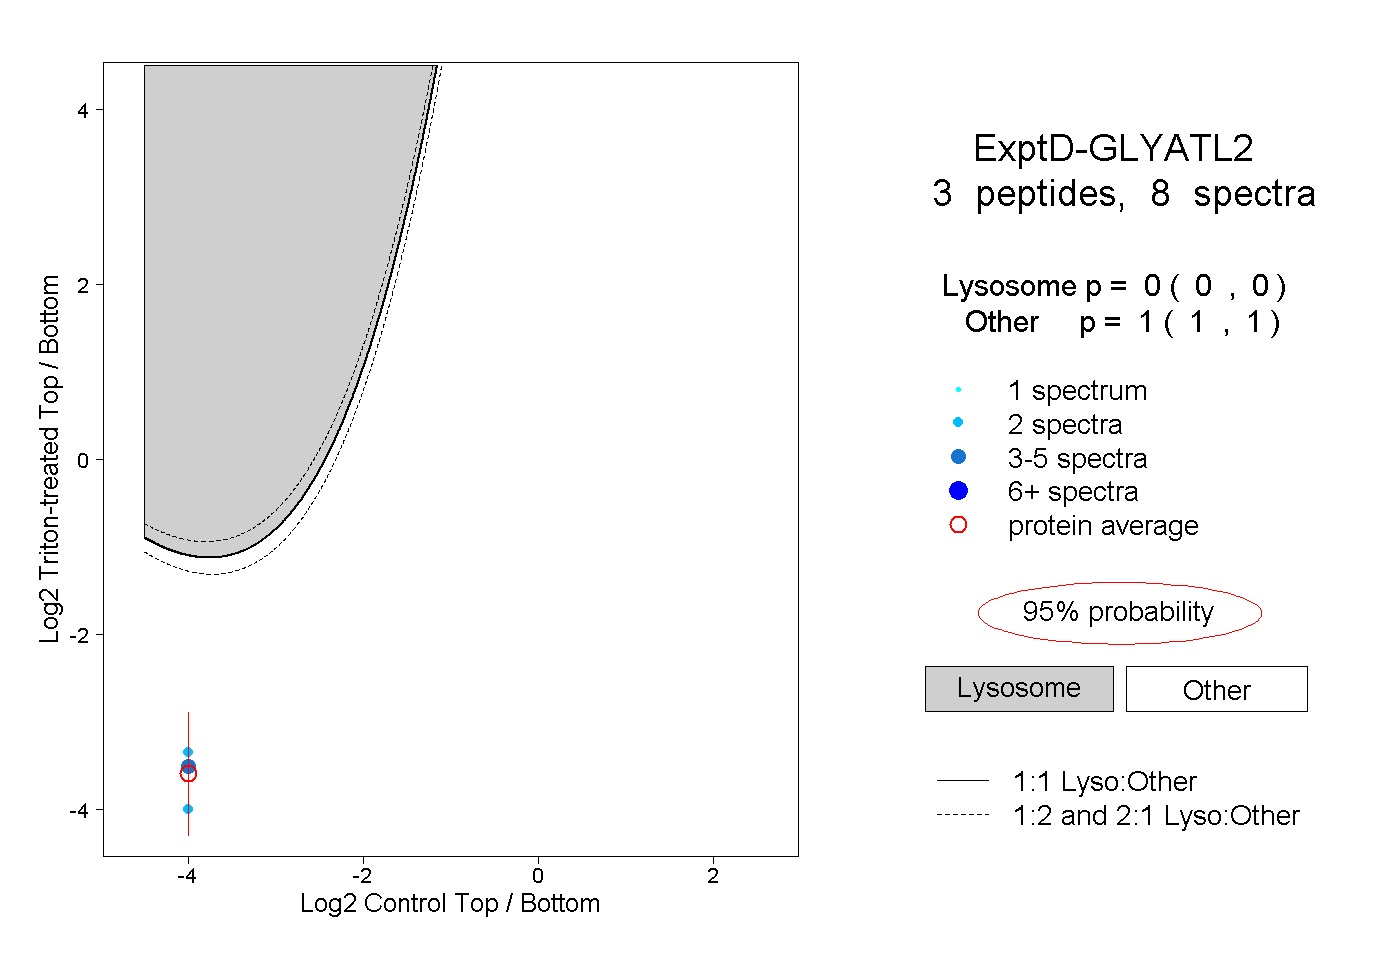
0.000 | 0.000
1.000 | 1.000