 7
7peptides
spectra
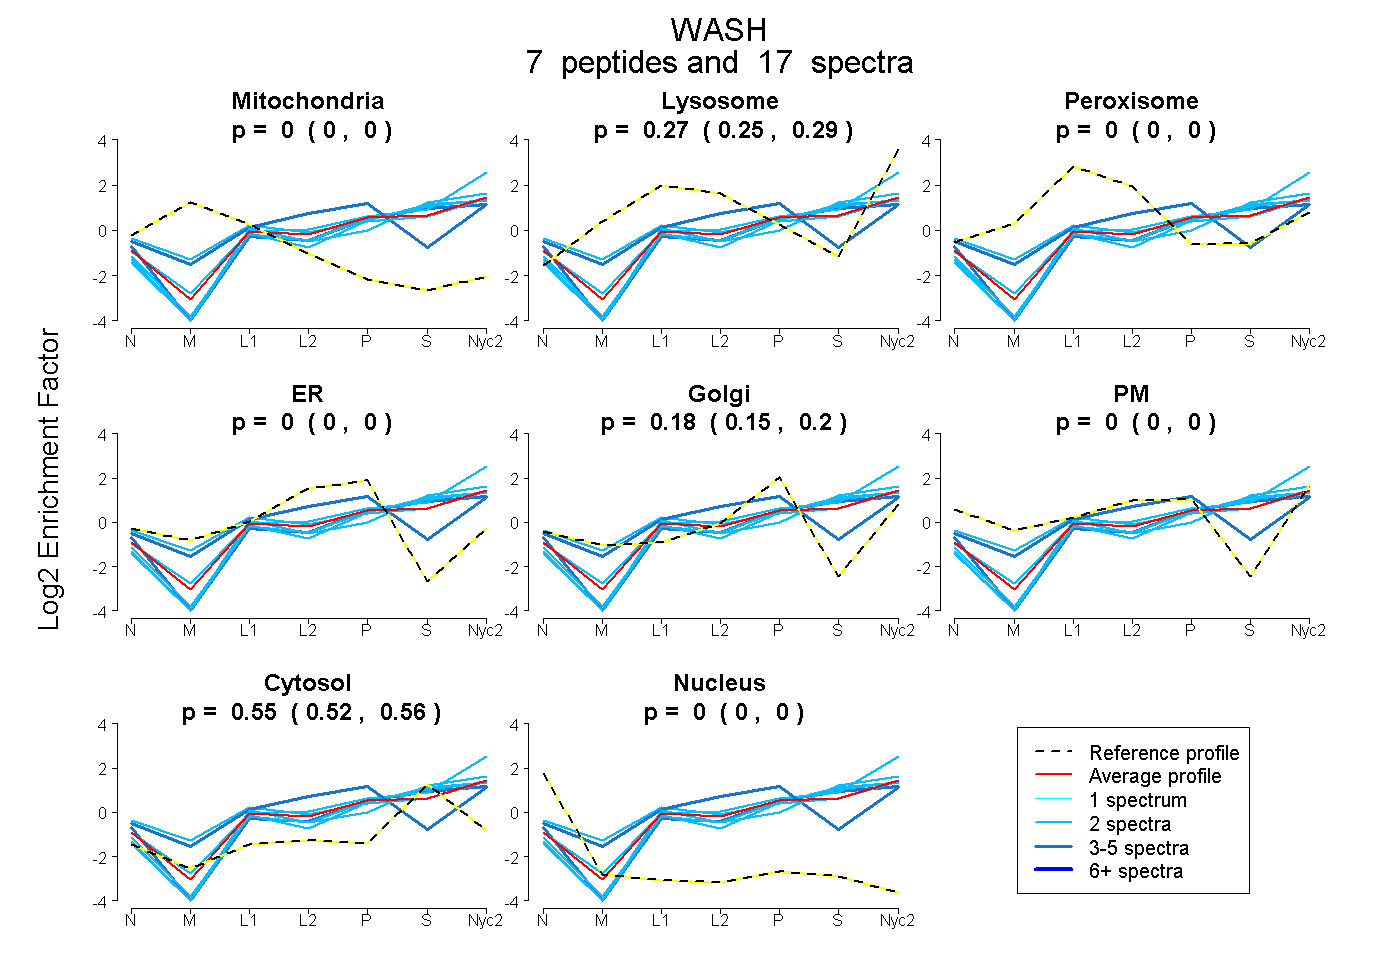
0.000 | 0.000
0.255 | 0.290
0.000 | 0.000
0.000 | 0.000
0.153 | 0.204
0.000 | 0.000
0.522 | 0.565
0.000 | 0.000
2peptides
spectra
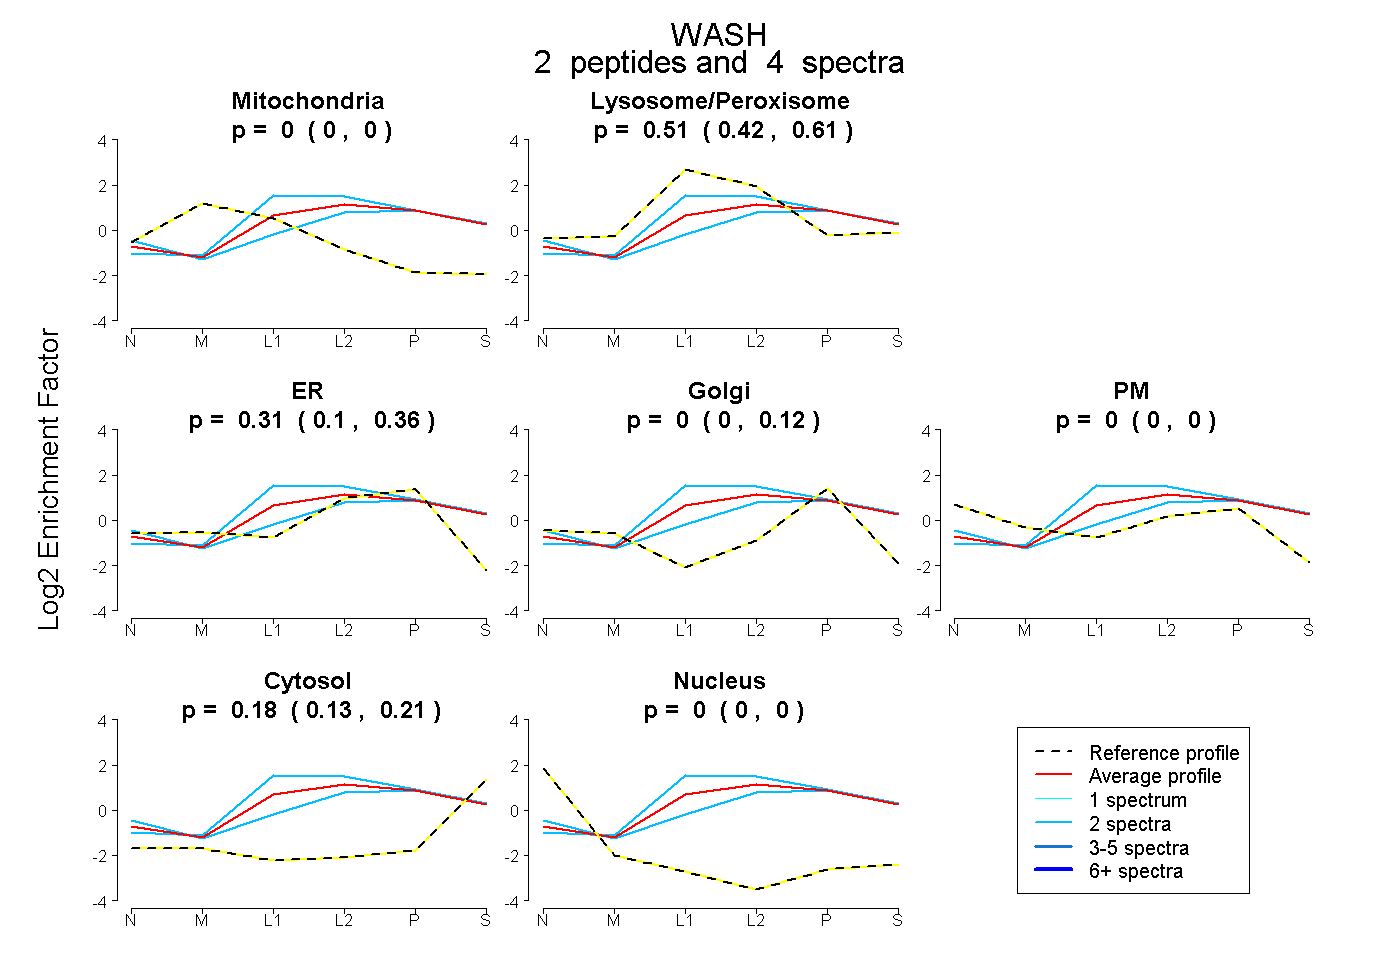
0.000 | 0.000
0.421 | 0.605
0.098 | 0.361
0.000 | 0.122
0.000 | 0.000
0.126 | 0.213
0.000 | 0.000
9peptides
spectra
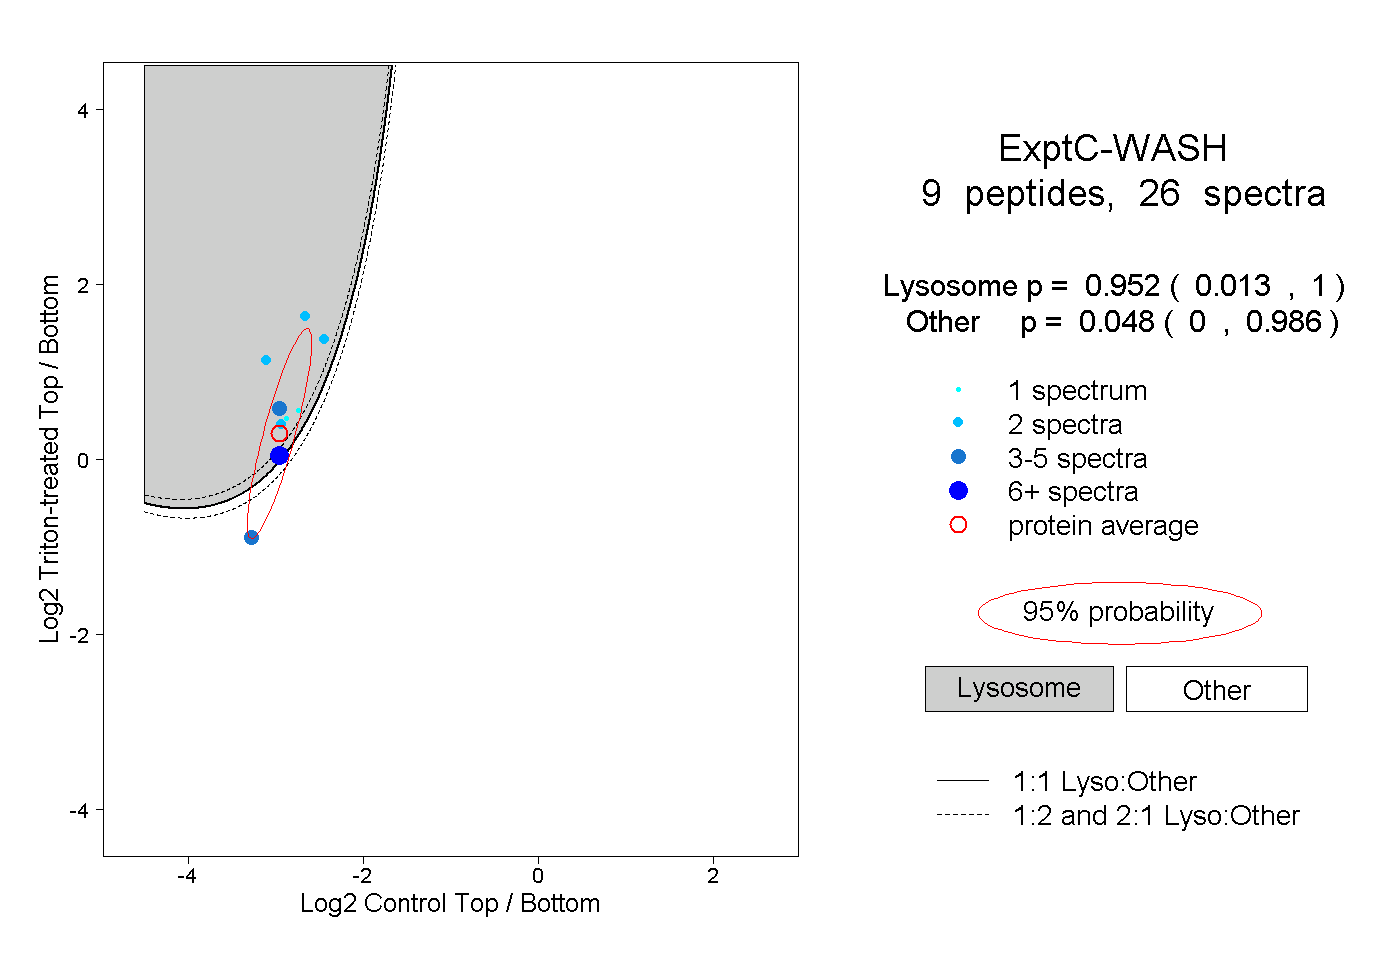
0.013 | 1.000
0.000 | 0.986