 7
7peptides
spectra
0.000 | 0.000
0.255 | 0.290
0.000 | 0.000
0.000 | 0.000
0.153 | 0.204
0.000 | 0.000
0.522 | 0.565
0.000 | 0.000
| Plot | Mito | Lyso | Perox | ER | Golgi | PM | Cytosol | Nucleus | |||||
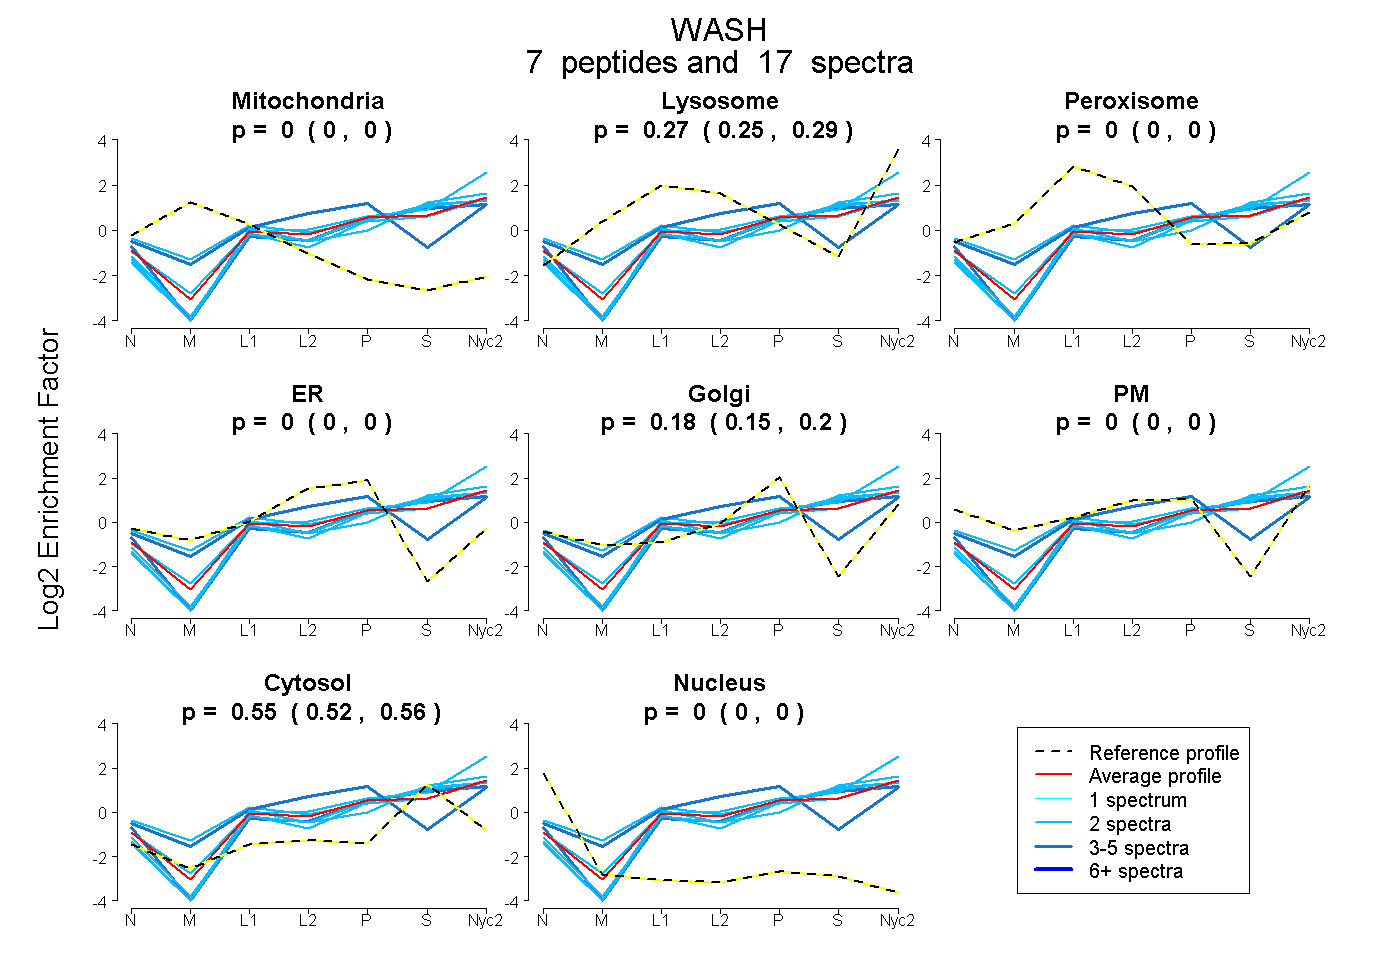
| Expt A |
7 peptides |
17 spectra |
|
0.000 0.000 | 0.000 |
0.274 0.255 | 0.290 |
0.000 0.000 | 0.000 |
0.000 0.000 | 0.000 |
0.180 0.153 | 0.204 |
0.000 0.000 | 0.000 |
0.546 0.522 | 0.565 |
0.000 0.000 | 0.000 |
| 2 spectra, QLQAIGER | 0.000 | 0.426 | 0.000 | 0.000 | 0.085 | 0.000 | 0.489 | 0.000 | ||
| 2 spectra, GPGTGTSEGPGGAFSR | 0.000 | 0.201 | 0.000 | 0.000 | 0.099 | 0.000 | 0.700 | 0.000 | ||
| 4 spectra, VFSSAK | 0.000 | 0.239 | 0.000 | 0.222 | 0.209 | 0.091 | 0.239 | 0.000 | ||
| 2 spectra, HRPLDER | 0.000 | 0.312 | 0.000 | 0.000 | 0.000 | 0.220 | 0.469 | 0.000 | ||
| 3 spectra, ATLLESIR | 0.000 | 0.154 | 0.000 | 0.000 | 0.194 | 0.000 | 0.653 | 0.000 | ||
| 2 spectra, YPAPEHLQEYNSVFTGALDPGLQR | 0.000 | 0.291 | 0.000 | 0.000 | 0.000 | 0.000 | 0.709 | 0.000 | ||
| 2 spectra, EVVDPSSGR | 0.000 | 0.216 | 0.000 | 0.000 | 0.126 | 0.000 | 0.658 | 0.000 |
| Plot | Mito | Lyso or Perox | ER | Golgi | PM | Cytosol | Nucleus | ||||||
| Expt B |
2 peptides |
4 spectra |
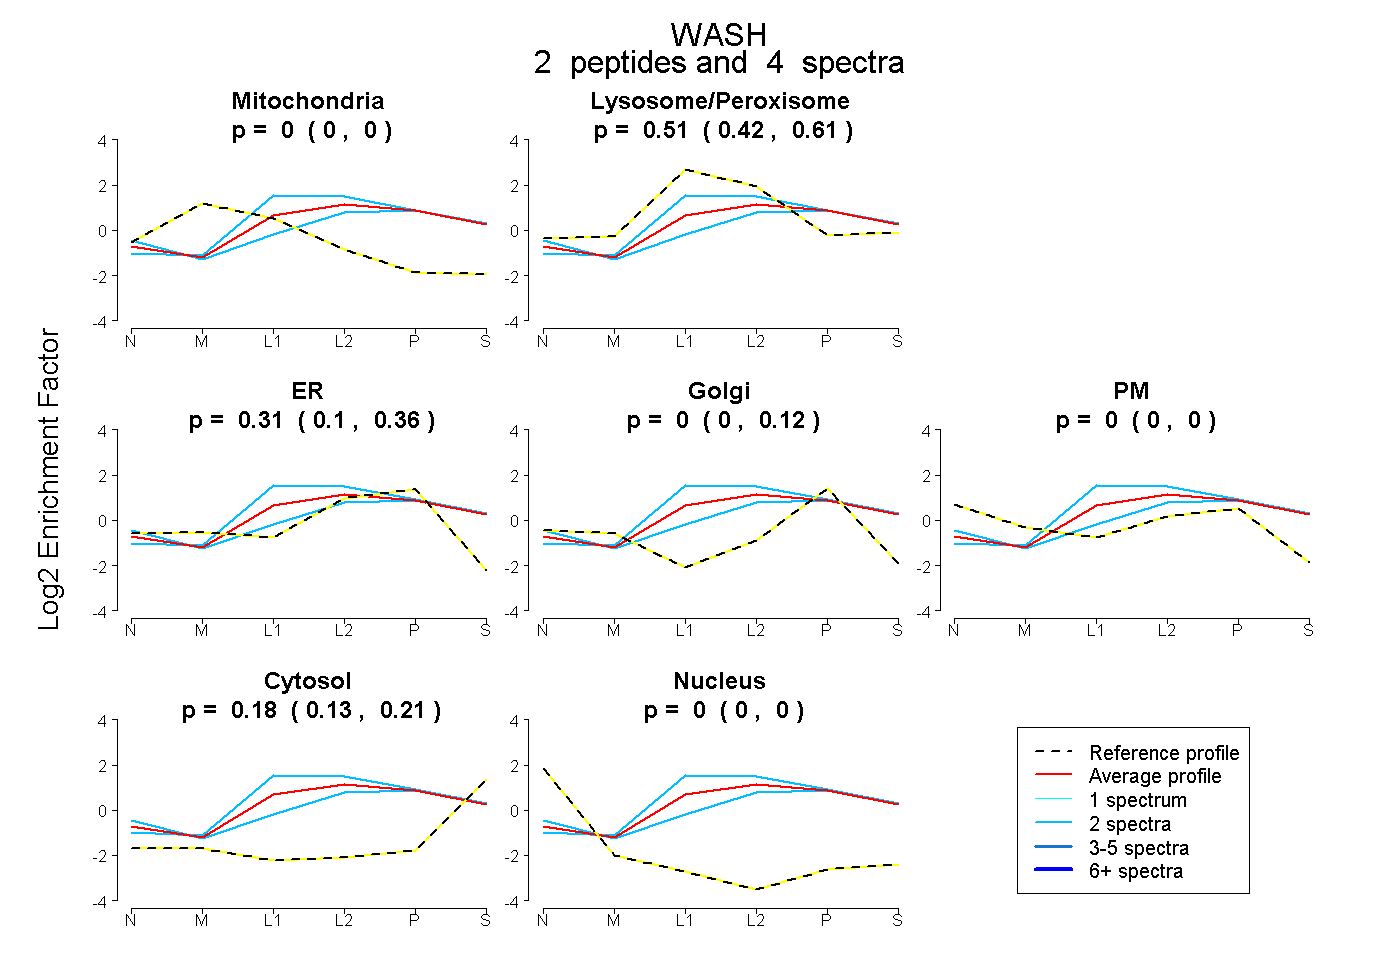 |
0.000 0.000 | 0.000 |
0.508 0.421 | 0.605 |
0.309 0.098 | 0.361 |
0.000 0.000 | 0.122 |
0.000 0.000 | 0.000 |
0.183 0.126 | 0.213 |
0.000 0.000 | 0.000 |
|||
| Plot | Lyso | Other | |||||||||||
| Expt C |
9 peptides |
26 spectra |
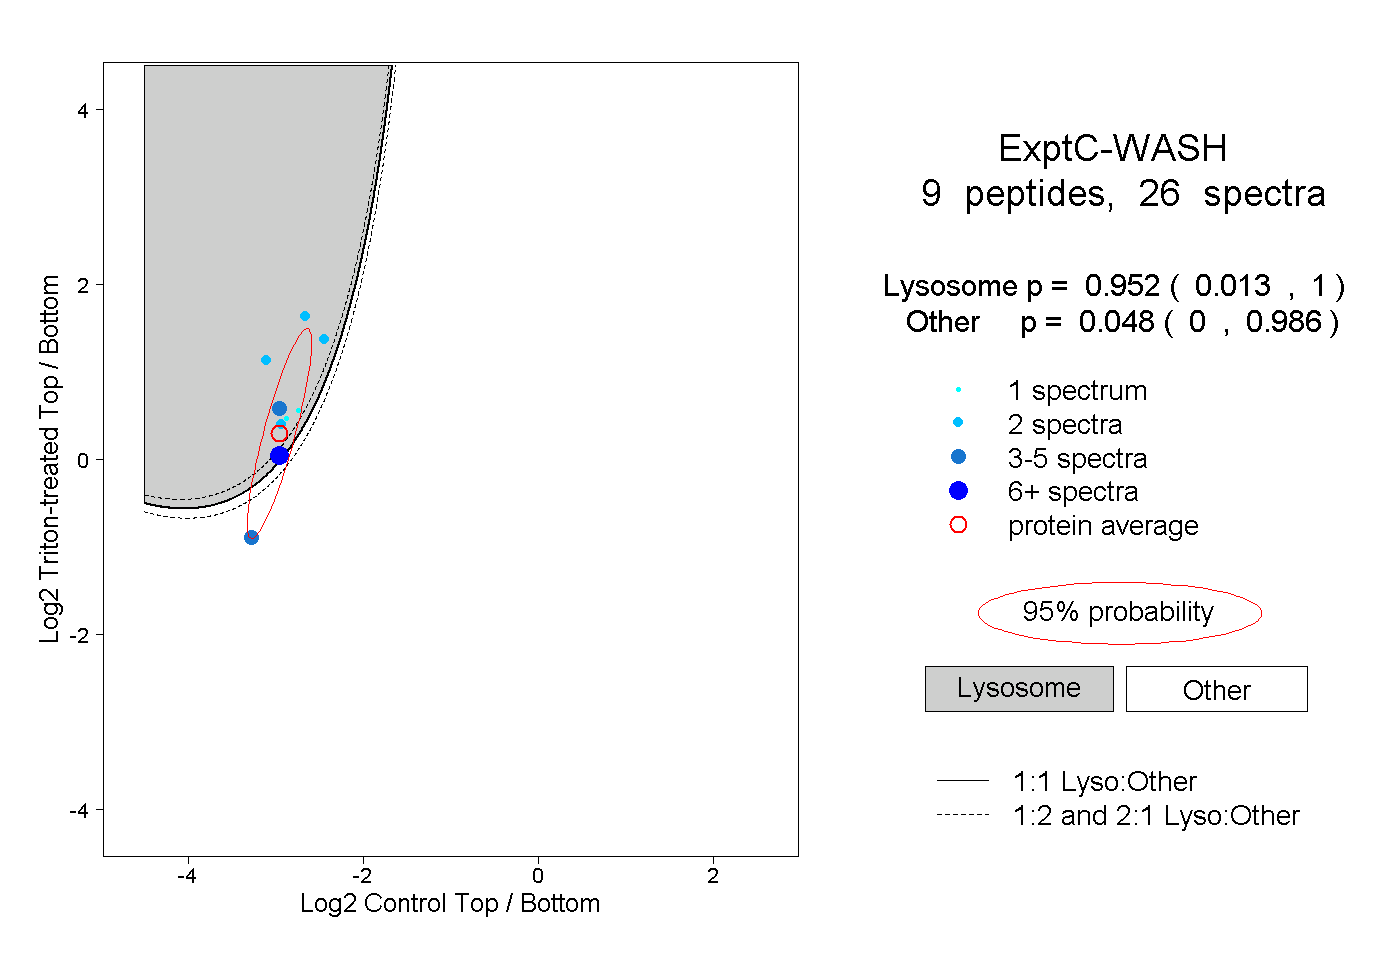 |
0.952 0.013 | 1.000 |
0.048 0.000 | 0.986 |