 3
3peptides
spectra
0.000 | 0.000
0.000 | 0.000
0.000 | 0.000
0.170 | 0.283
0.000 | 0.092
0.000 | 0.014
0.509 | 0.546
0.180 | 0.217
1peptide
spectra
NA | NA
NA | NA
NA | NA
NA | NA
NA | NA
NA | NA
NA | NA
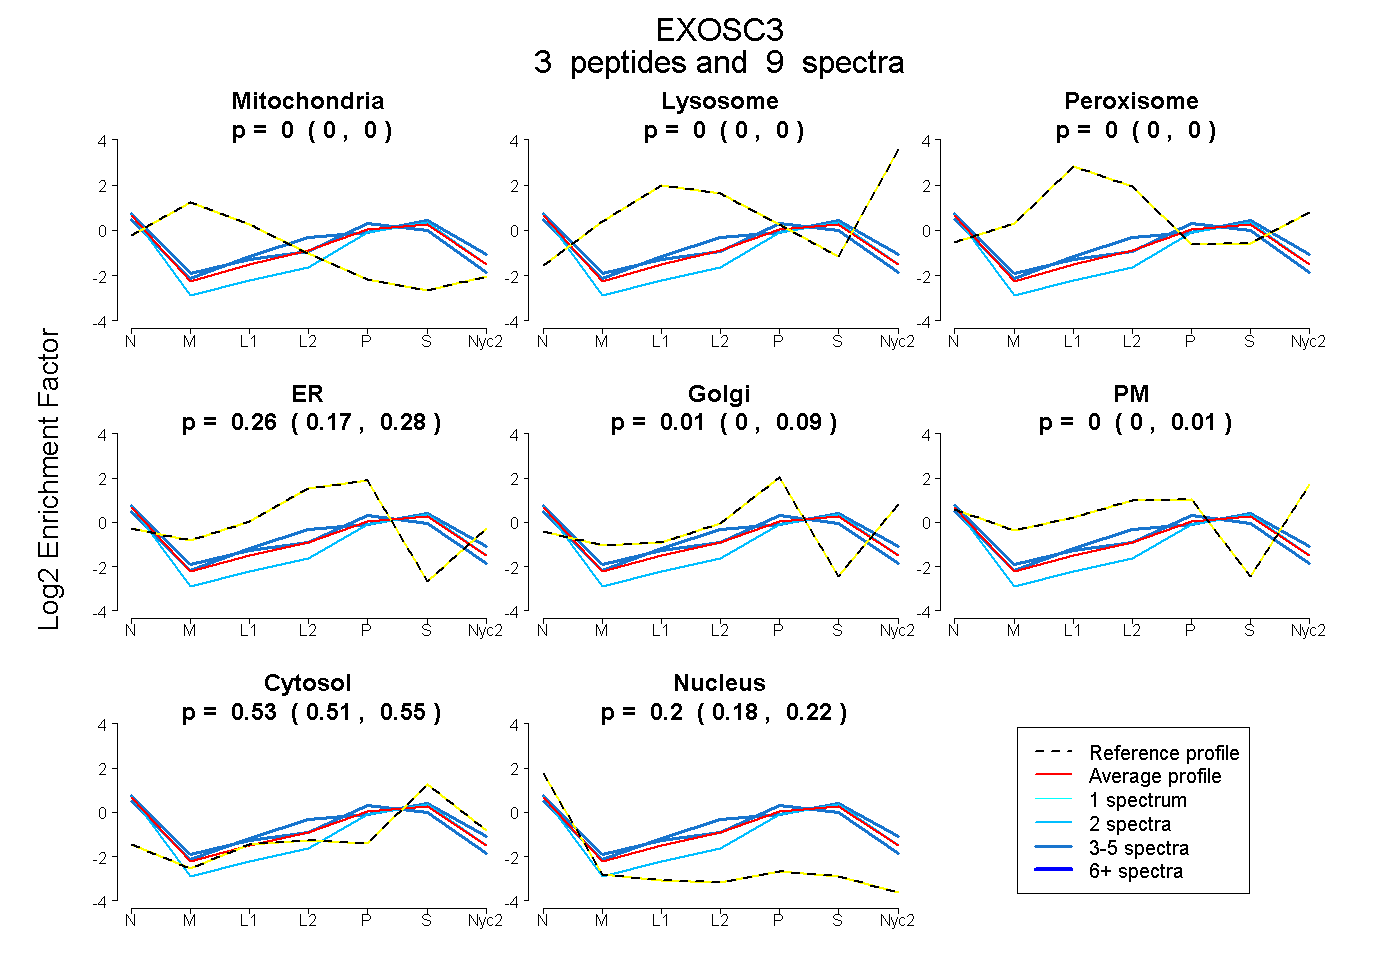
| Plot | Mito | Lyso | Perox | ER | Golgi | PM | Cytosol | Nucleus | |||||
| Expt A |
3 peptides |
9 spectra |
|
0.000 0.000 | 0.000 |
0.000 0.000 | 0.000 |
0.000 0.000 | 0.000 |
0.256 0.170 | 0.283 |
0.012 0.000 | 0.092 |
0.000 0.000 | 0.014 |
0.531 0.509 | 0.546 |
0.200 0.180 | 0.217 |
||
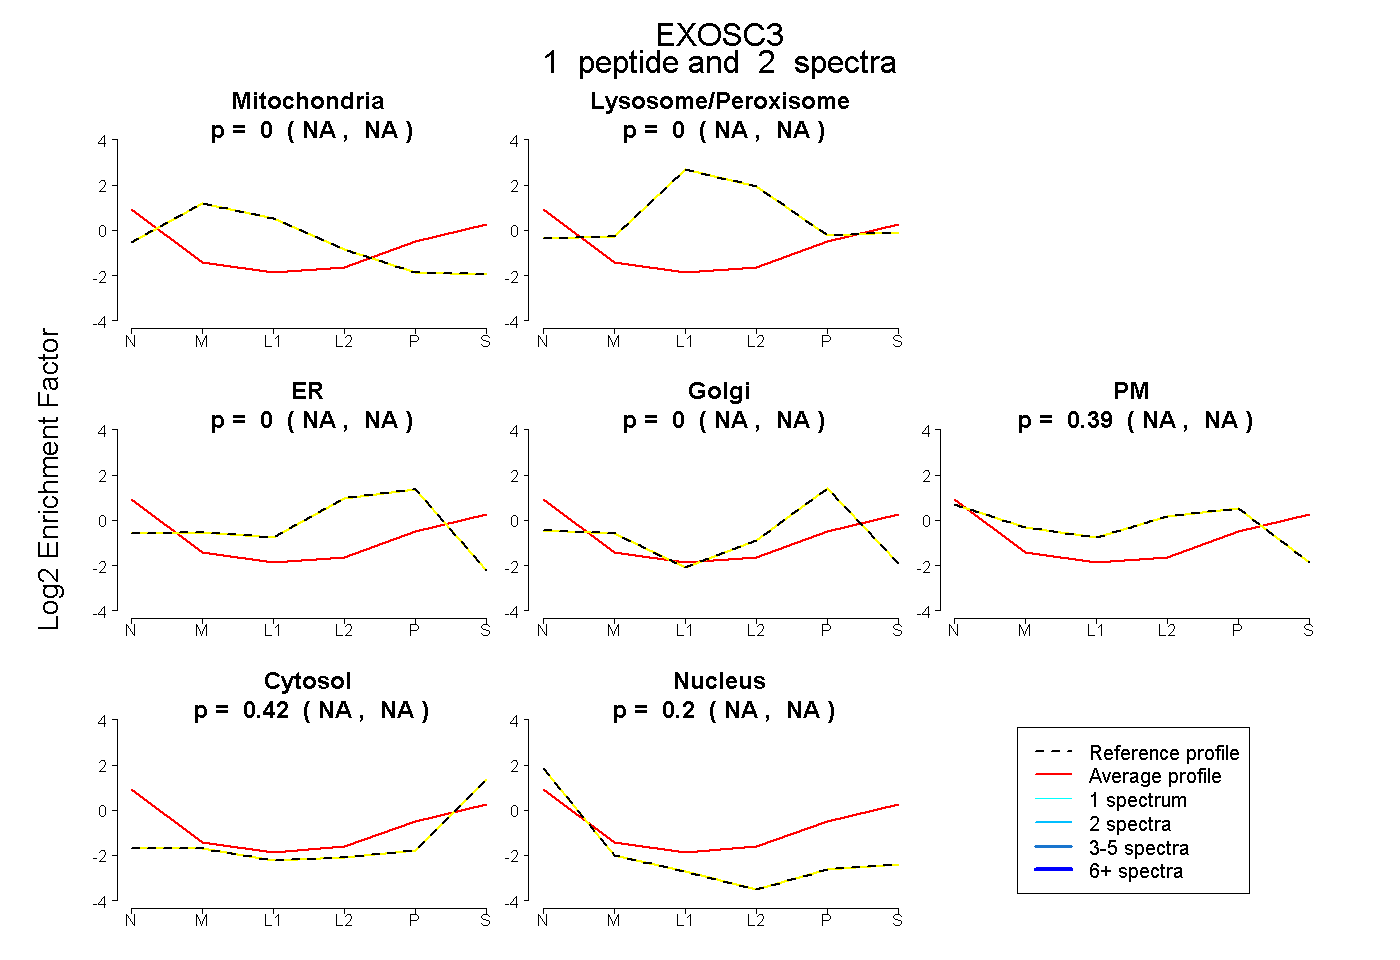
| Plot | Mito | Lyso or Perox | ER | Golgi | PM | Cytosol | Nucleus | ||||||
| Expt B |
1 peptide |
2 spectra |
|
0.000 NA | NA |
0.000 NA | NA |
0.000 NA | NA |
0.000 NA | NA |
0.388 NA | NA |
0.415 NA | NA |
0.196 NA | NA |